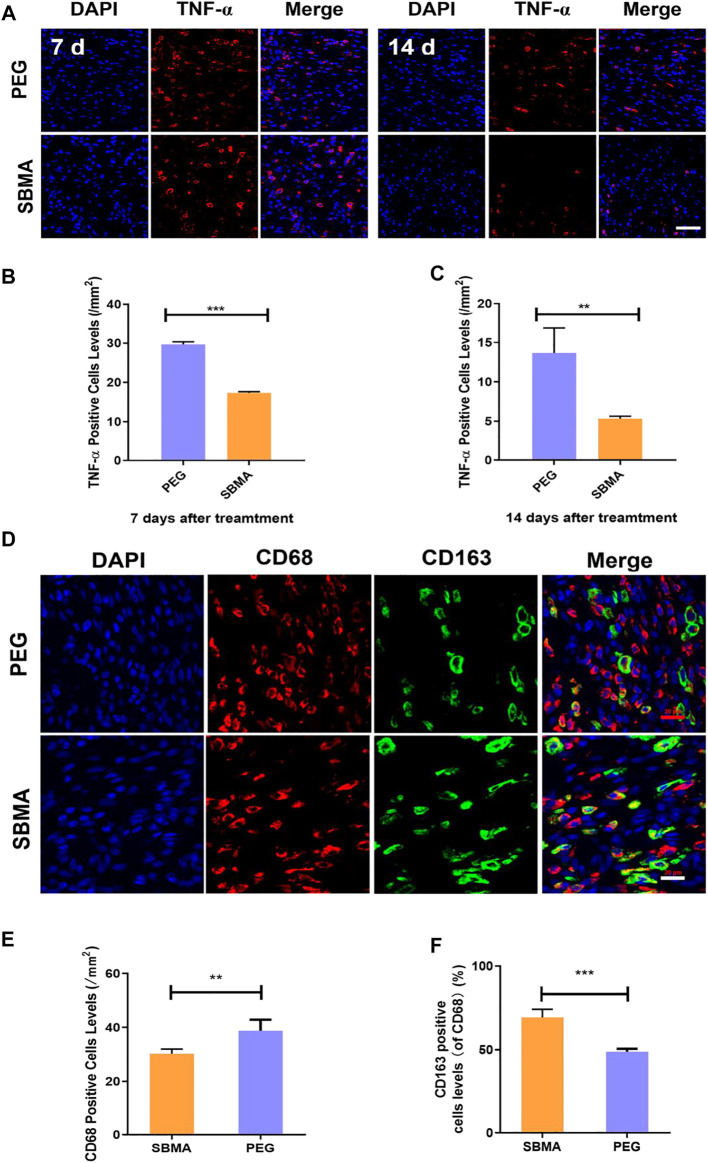
FIGURE 7.
In vivo expression of the inflammation factor. (A) Immunofluorescent staining of TNF-α for wounds treated by PEG or SBMA hydrogels on day 7 and day 14. Red: TNF-α; blue: DAPI, nuclei. The scale bar was 50 µm. (B) Quantified TNF-α–positive cells levels on day 7 at wound sites after the treatments of PEG or SBMA hydrogels. (C) Quantified TNF-α–positive cell levels on day 14 at wound sites after the treatments of PEG or SBMA hydrogels. (D) Immunofluorescent staining of macrophages. CD68: total macrophage; CD163: M2 phenotype macrophage; DAPI: nuclei (scale bar = 20 μm). (E) Bar diagram of the CD68-positive cell level, n = 3. (F) Bar diagram of the percentage level of CD163-positive cell in comparison to CD68-positive cells. Significant difference is indicated as **p < 0.01, ***p < 0.001, and n = 3.

