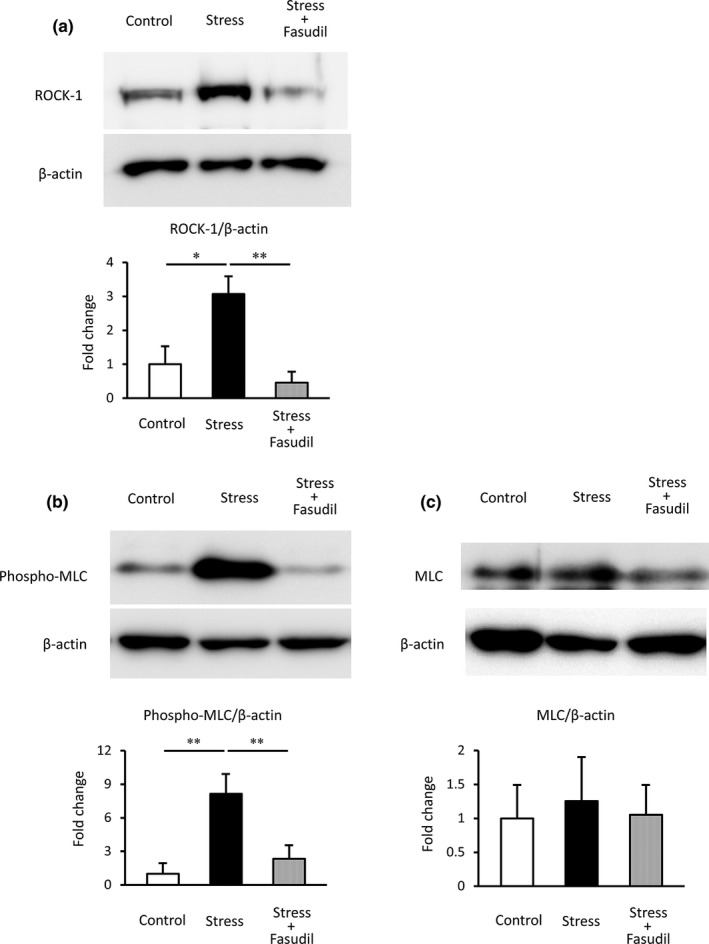
FIGURE 5.

Protein levels of ROCK‐1 (a) and phospho‐MLC (b) in rat corpus cavernosum. Quantification was performed by densitometry analysis, with normalization to β‐actin. Data are expressed as the ratio compared with the control. Data are reported as means ± standard deviations (n = 5–6/group). *p < 0.05, **p < 0.01 using Bonferroni's multiple t‐tests. ROCK‐1, Rho kinase‐1; phospho‐MLC, phosphorylated‐myosin light chain
