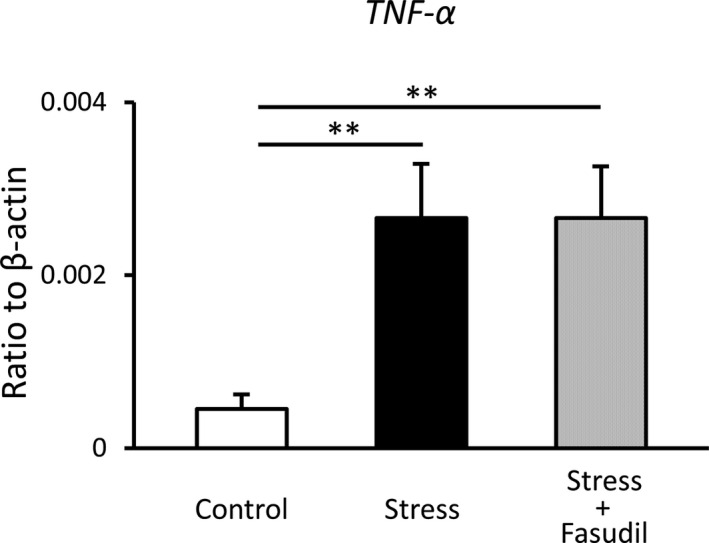
FIGURE 7.

mRNA expression levels of inflammatory cytokines in the rat corpus cavernosum. Target gene expression was quantified relative to the expression of β‐actin using the comparative cycle threshold method. Data are reported as means ± standard deviations (n = 5–6/group). *p < 0.05, **p < 0.01 using Bonferroni's multiple t‐tests. TNF‐α, tumor necrosis factor‐α
