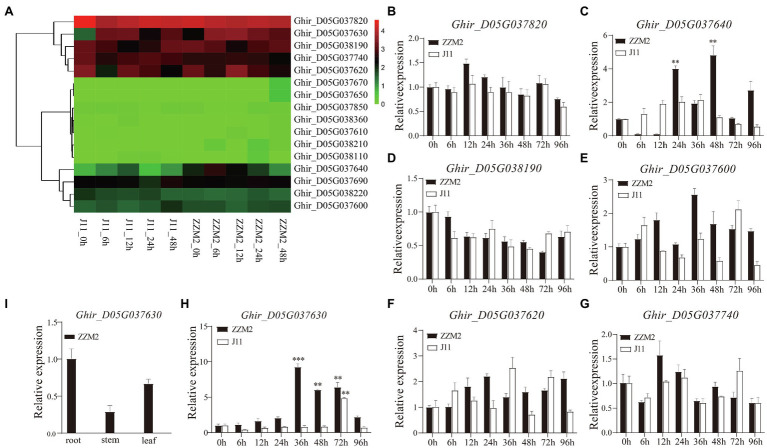
Figure 3.
Differential expression of candidate genes. (A) Heatmap of the 17 candidate genes in transcriptome analysis. (B–H) Expression patterns of the seven candidate genes at 0, 6, 12, 24, 36, 48, 72, and 96h after infection with V. dahliae in root of ZZM2 and J11. (I) Expression patterns of Ghir_D05G037630 in root, stem, and leaf in ZZM2. The error bar represents the standard deviation of three biological replicates. Asterisk indicates statistically significant differences determined by Student’s t-test (**p<0.01; ***p<0.001).

