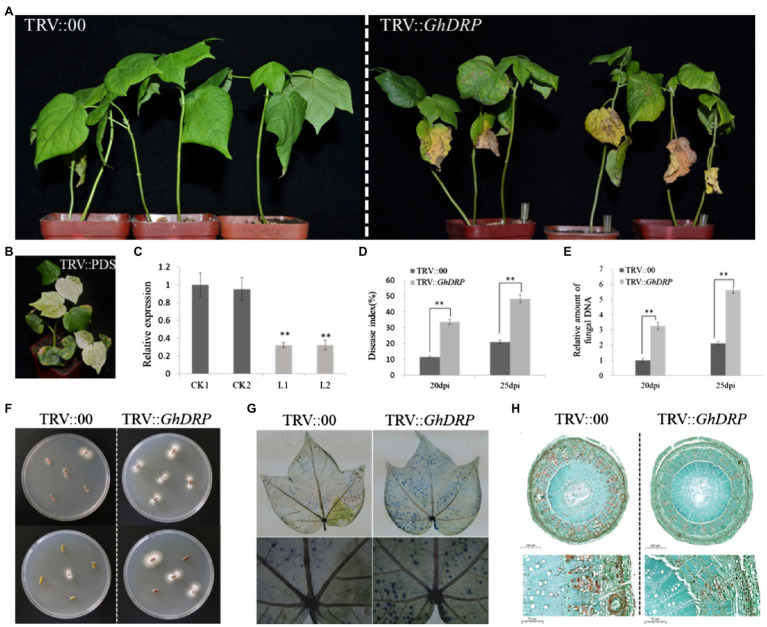
Figure 4.
Effect of GhDRP silencing on V. dahliae resistance of cotton. (A) Phenotypes of TRV::GhDRP and TRV::00 plants induced by V. dahliae at 25 dpi. (B) Phenotype of positive control. (C) Transcript levels of GhDRP in the leaves of TRV::GhDRP and TRV::00 plants. CK1 and CK2 represent the control plants TRV::00; L1 and L2 represent the gene silencing plants TRV::GhDRP. Asterisk indicates statistically significant differences determined by Student’s t-test (**p<0.01), and the same below. (D) DI in TRV::GhDRP and TRV::00 plants at 20 dpi and 25 dpi. (E) Relative amount of fungal DNA in the leaves of TRV::GhDRP and TRV::00 plants at 20 dpi and 25 dpi. (F) The fungi in the stem segment were restored on PDA culture medium. (G) Trypan blue staining of the leaves of TRV::GhDRP and TRV::00 plants at 25 dpi. (H) Cell morphology of the stem cross section of TRV::GhDRP and TRV::00 plants at 25 dpi.

