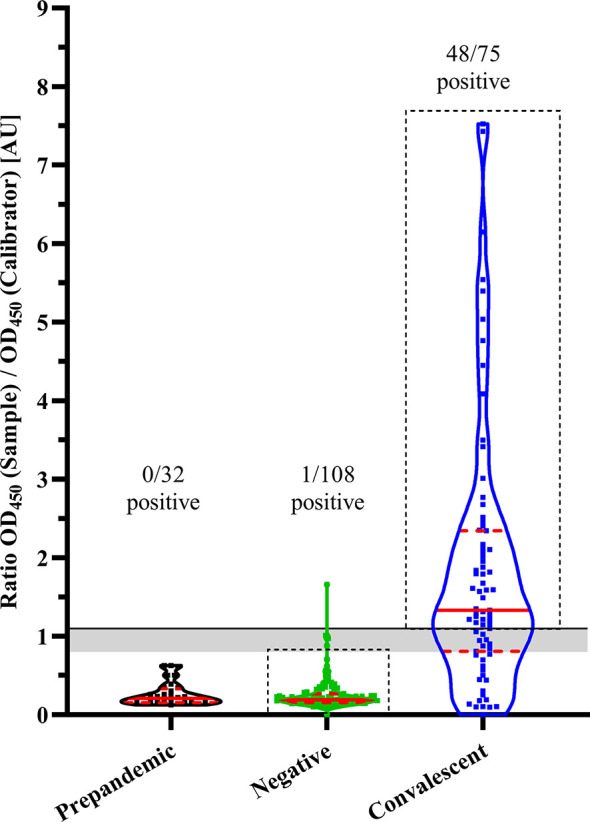
Figure 1.

SARS-CoV-2 IgG levels in plasma of adult control groups. IgG concentrations reactive to SARS-CoV-2 were estimated by commercial ELISA (EUROIMMUN). Results are shown as violin plots. Prepandemic: plasma collected 2015-2019, Negative: Individuals without (known) SARS-CoV-2 infection, Convalescent: Individuals with previous COVID-19. Solid line: Cut-off for SARS-CoV-2 IgG positivity; grey area: intermediate antibody concentration; solid red lines: median; dashed red lines: quartiles. Black dashed-line boxes highlight selected individuals for subsequent ELISAs.
