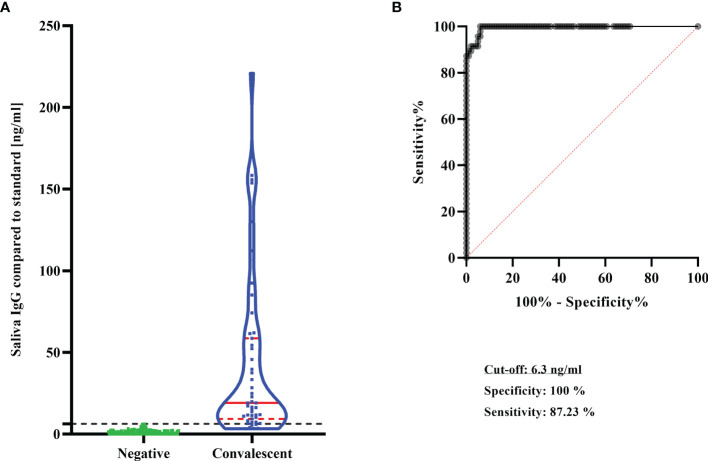
Figure 2.
Performance of the saliva ELISA. (A) SARS-CoV-2 IgG concentrations in saliva in the negative group (n = 99) and in the convalescent group (n = 47). Results are shown as violin plots. Solid red lines: median; dashed red lines: quartiles, Dashed black line: cut-off of SARS-CoV-2 IgG positivity. (B) ROC curve analysis to determine diagnostic test performance of saliva ELISA.

