Figure 3.
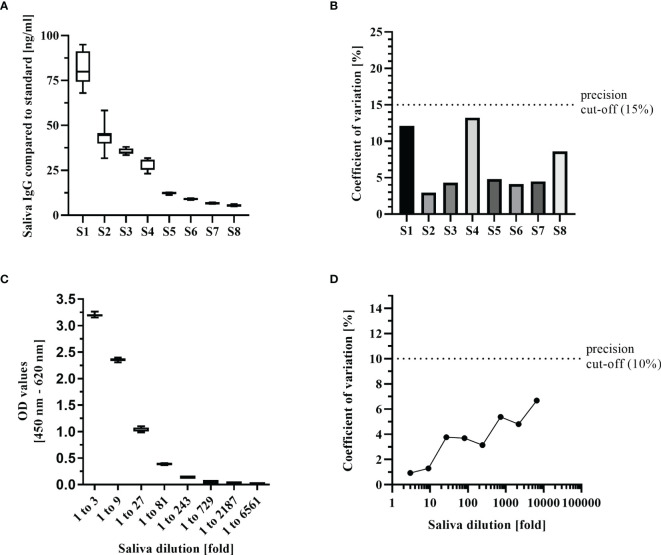
Key performance indicators of the saliva ELISA. (A) Inter-assay precision was estimated by measuring 8 samples in triplicates on 3 different days. Samples were selected to represent a range of IgG concentrations from high to negative. Results are shown as boxplots (median with interquartile range, whiskers represent 1.5x interquartile range). (B) The coefficient of variation of the inter-assay was calculated for each of the 8 samples. (C) Intra-assay precision was estimated by measuring a positive sample in 12 replicates with 8 3-fold dilutions and represented as boxplots. (D) Coefficient of variation of the intra-assay was calculated for each of the 8 dilutions.

