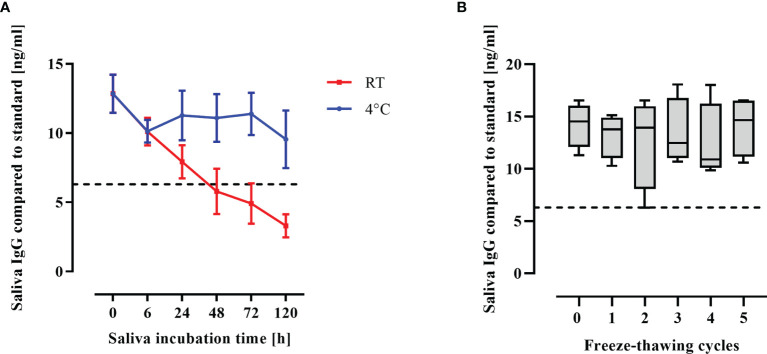
Figure 4.
Antibody stability in saliva. (A) Saliva was kept at RT or at 4°C for respective durations (h) after collection and SARS-CoV-2 IgG concentrations were measured by saliva ELISA. Mean and standard error of the mean of 4 biological replicates is shown. (B) Collected saliva was subjected to freeze-thaw cycles and IgG concentrations were measured by saliva ELISA. IgG concentrations is shown as boxplots. Dashed line: Cutoff for antibody positivity.

