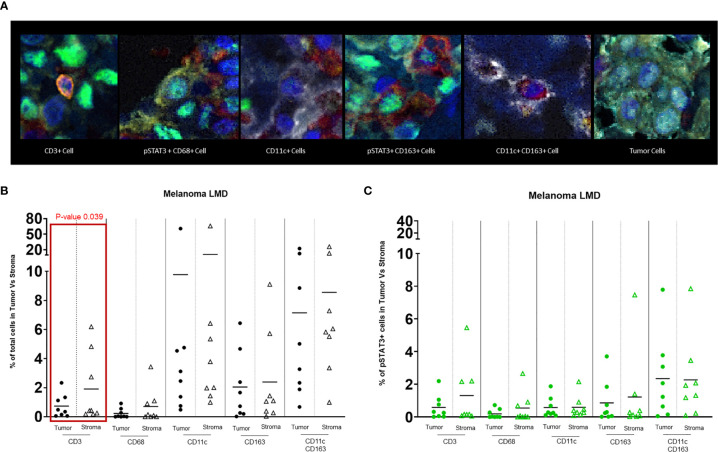
Figure 2.
(A) Representative images of different cell populations seen in the TME of melanoma LMD: pSTAT3-CD3+ T cells, pSTAT3+CD68+ macrophages, pSTAT3-CD11c+ APCs, pSTAT3+CD163+ macrophages, pSTAT3-CD11c+CD163+ APCs, and tumor cells demonstrating heterogenous nuclear expression of pSTAT3. (B) Dot-plot representing the percentages of total immune cells in the tumor area vs stroma. The black circles represent the total immune cell populations in the tumor and the black-outlined triangles represent the total immune cells in the stroma. Each circle or triangle represent a specimen. There is a significant difference between the percentages of CD3+ T cells in the stroma vs in the tumor (p= 0.039). (C) Dot-plot representing percentages of pSTAT3+ immune cells in the tumor area vs stroma. The green circles represent pSTAT3+ immune cell populations in the tumor area and the green-outlined triangles represent pSTAT3+ immune cells in the stroma. Each circle or triangle represent a specimen.

