Figure 3.
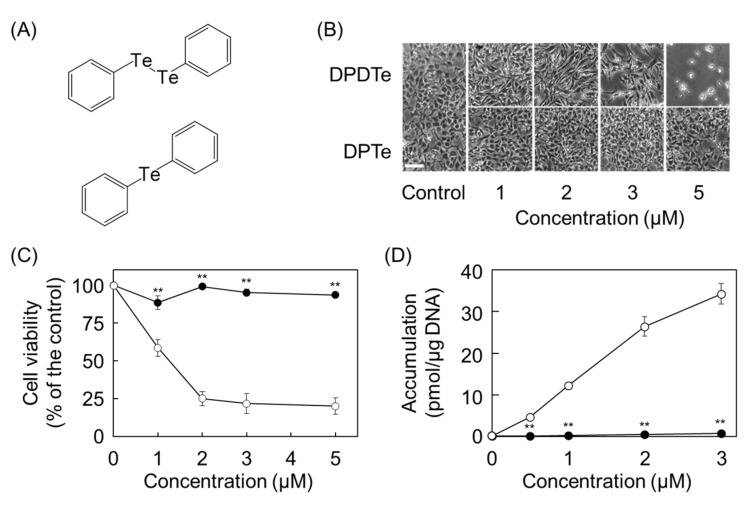
Assessment of contribution of the Te–Te bond to cytotoxicity of DPDTe. (A) Structure of DPDTe (top) and DPTe (bottom). (B) Morphological observation (bar = 50 µm), (C) viability of vascular endothelial cells treated with DPDTe (white) and DPTe (black), and (D) intracellular accumulation of DPDTe (white) and DPTe (black) in vascular endothelial cells after treatment (0.5, 1, 2, 3, or 5 µM) for 24 h. Values are expressed as the mean ± standard error of three replicates. ** p < 0.01 compared with the corresponding DPDTe treatment.

