
Figure 2. Distribution of Preliminary Residency Application Rankings by Applicant Subgroup, 2019-2020.
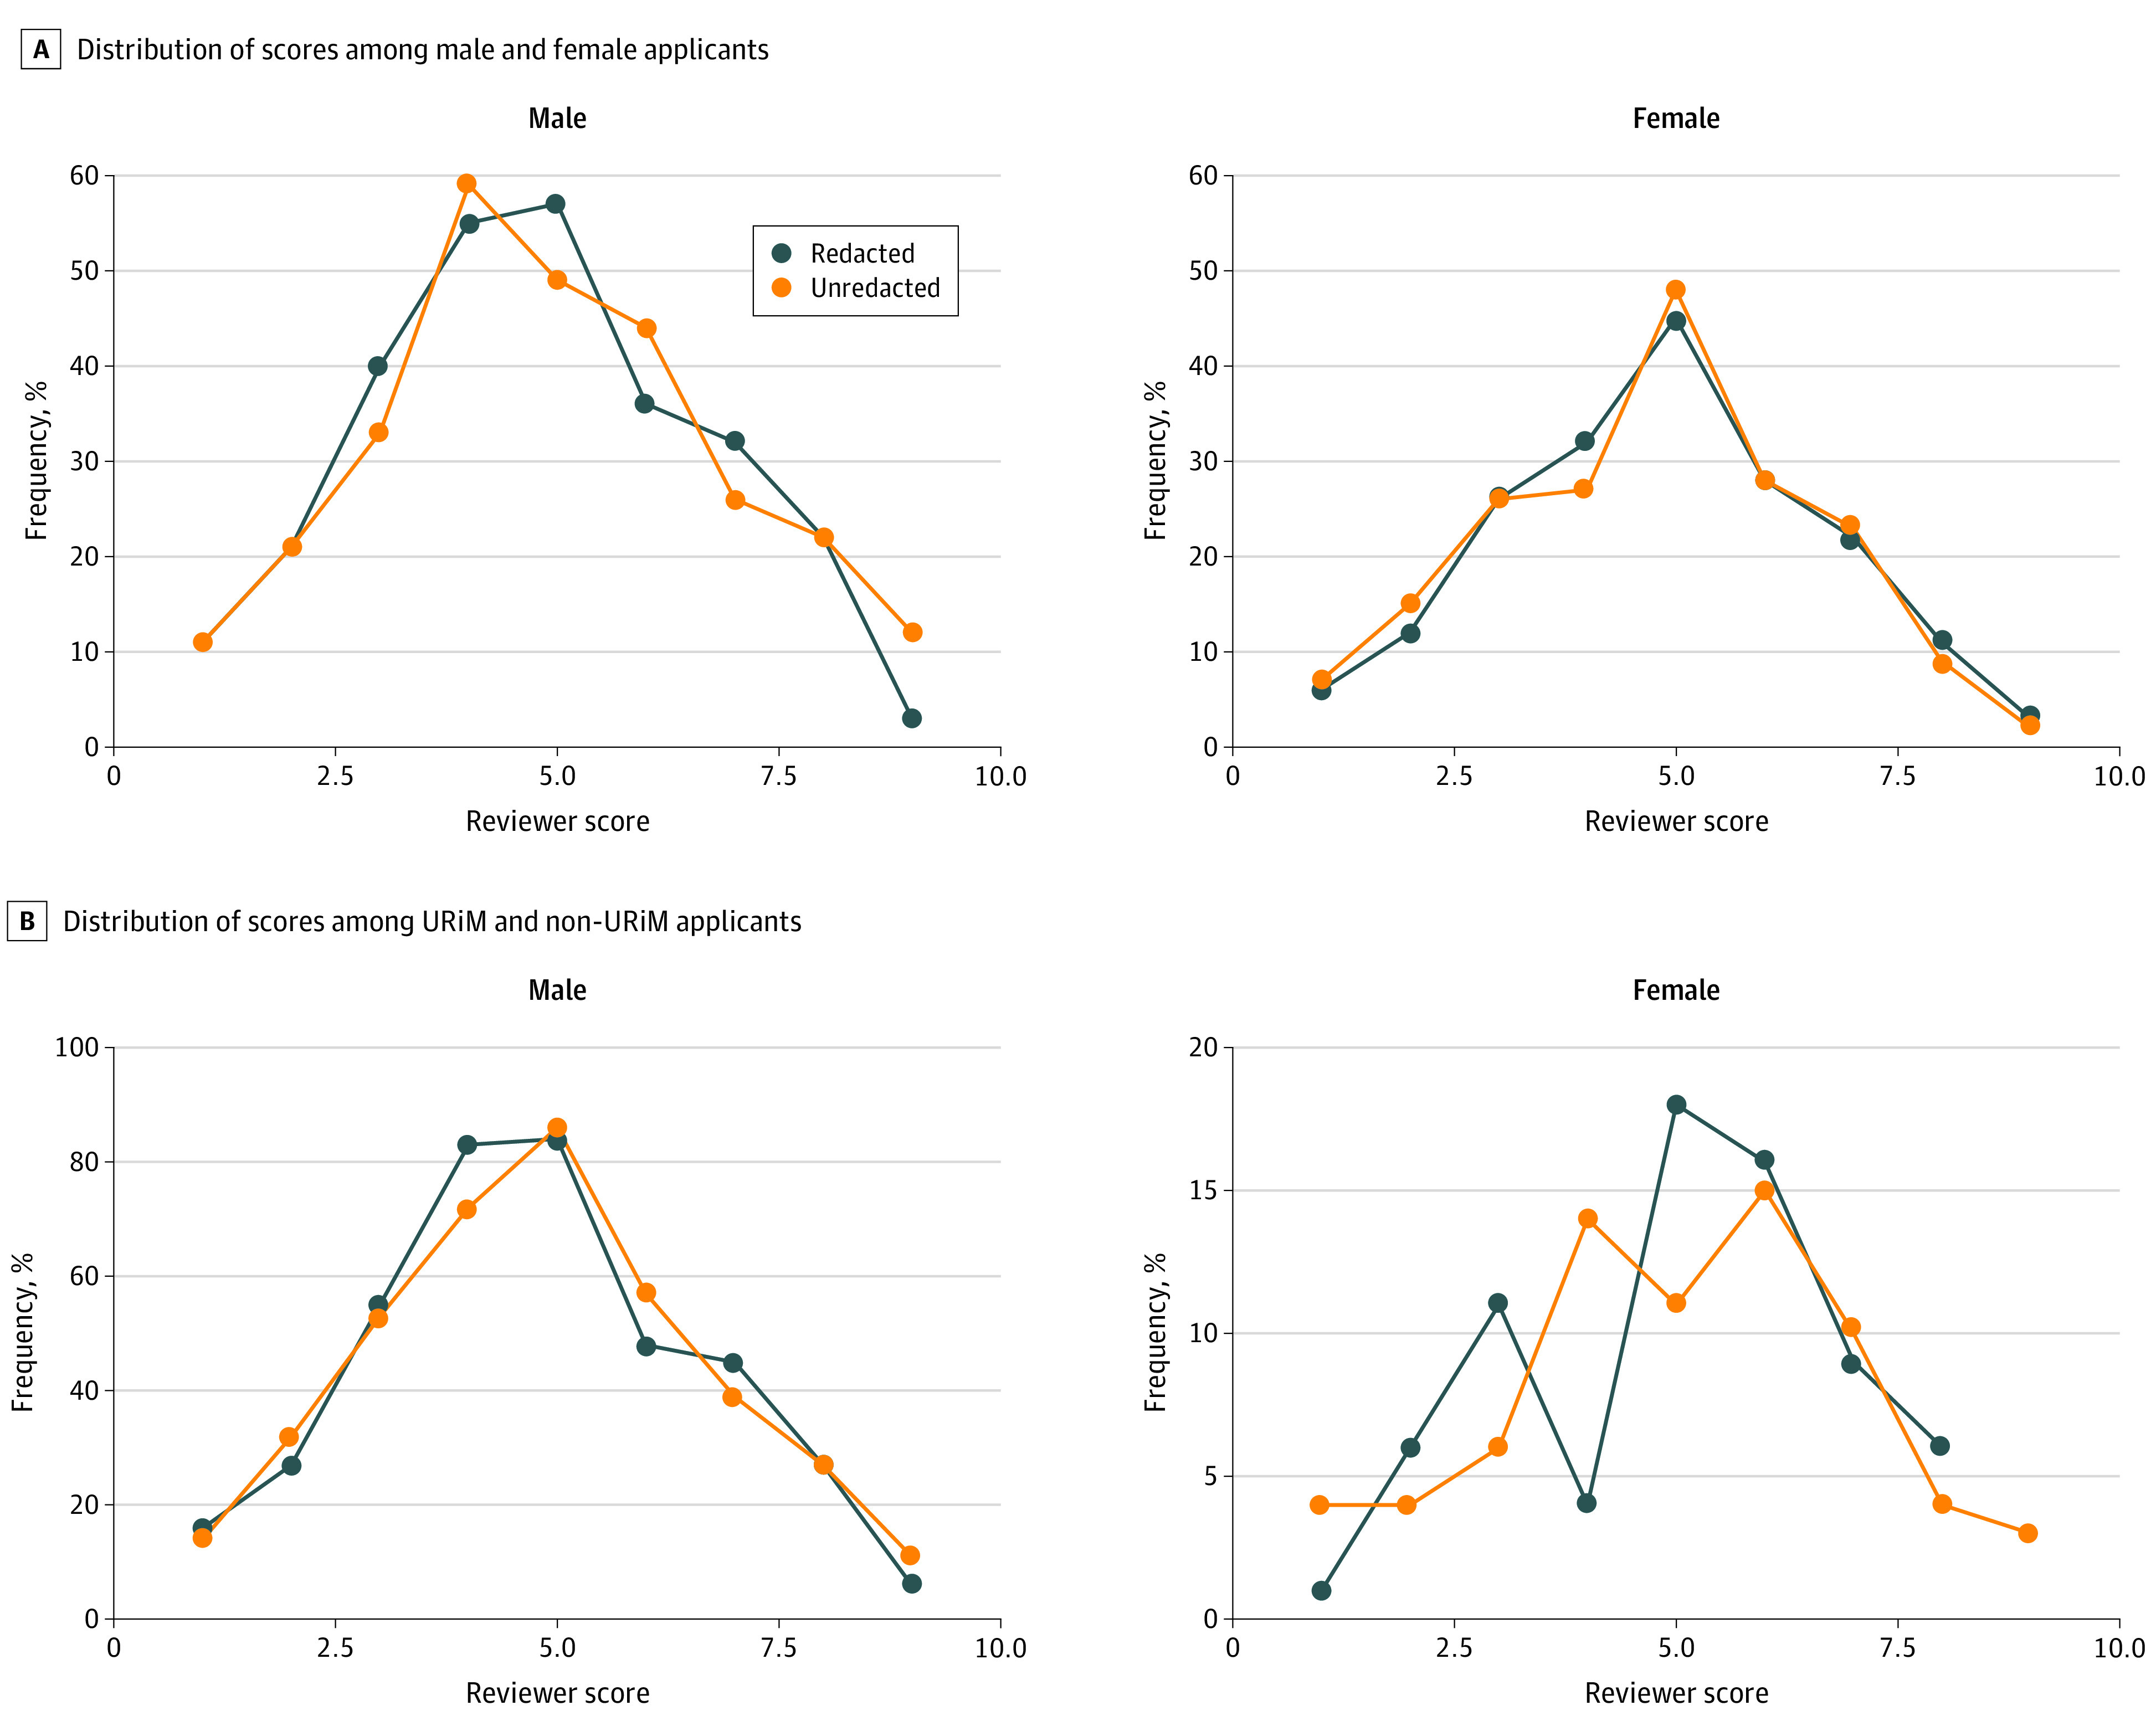
A, Distribution of redacted and unredacted reviewer scores among male and female applicants. P = .23 (male applicants) and P = .57 (female applicants) for a statistically significant difference between redacted and unredacted scores. B, Distribution of redacted and unredacted reviewer scores among underrepresented in medicine (URiM) and non-URiM applicants. P = .95 (URiM applicants) and P = .56 (non-URiM applicants) for a statistically significant difference between redacted and unredacted scores.