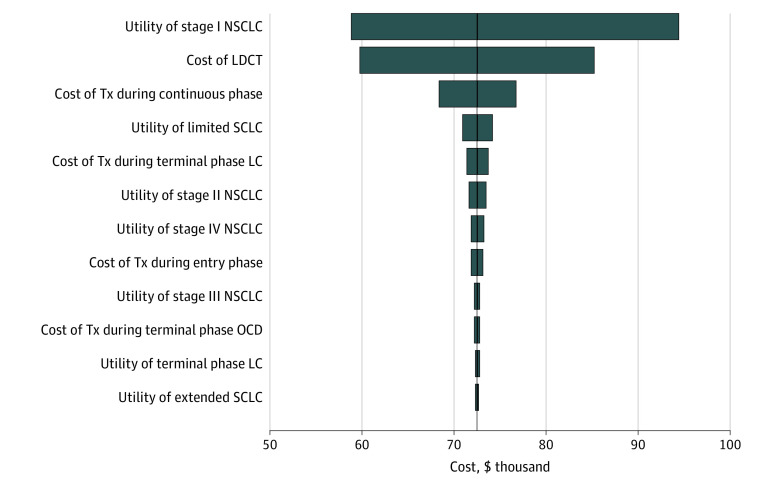
Figure 2. Univariate Sensitivity Analyses of the 2021 vs 2013 US Preventive Services Task Force Screening Strategies for Lung Cancer.
The tornado diagram illustrates the change in the incremental cost-effectiveness ratio (ICER), which was defined as the cost of the 2021 US Preventive Services Task Force (USPSTF) strategy minus the cost of the 2013 USPSTF strategy divided by the difference of the quality-adjusted life-year of the 2021 USPSTF strategy minus the quality-adjusted life-year of the 2013 USPSTF strategy when important input parameters were varied for both strategies (1 strategy at a time) by 25% higher or lower than their base-case values (shown in eTable 2 and eTable 3 in the Supplement). The vertical axis (solid dark line) shows the estimated ICER for the base-case analysis. The baseline ICER was $72 564. The left column of the tornado diagram shows the input parameters in descending order of their impact for the results (eg, the ICER of the 2021 USPSTF strategy vs the 2013 USPSTF strategy was most sensitive to changes in the health utility of stage I non–small cell lung cancer [NSCLC] and the least sensitive to changes in the health utility of extended small cell lung cancer [SCLC]). LC indicates lung cancer; LDCT, low-dose computed tomography; OCD, other causes of death; and Tx, treatment.

