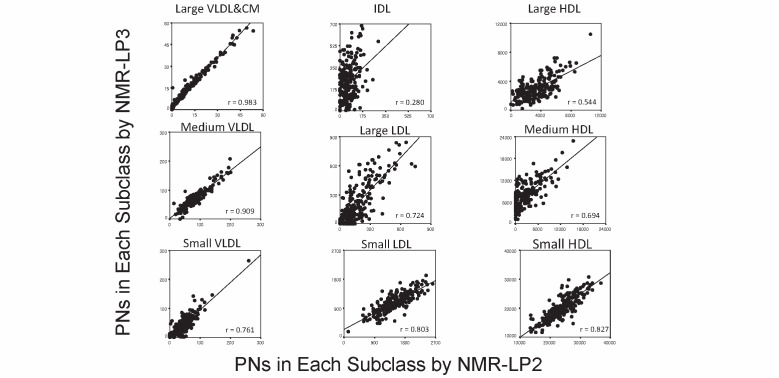
Supplementary Fig.3. Comparison of the PNs in each subclass between NMR-LP2 and LP3 (baseline data n =212) .
The horizontal axis is the data by NMR-LP2 and vertical axis shows those by NMR-LP3, respectively. The r values were calculated by Spearman correlation and those in the parenthesis by Spearman correlation. All p values were p <0.0001.

