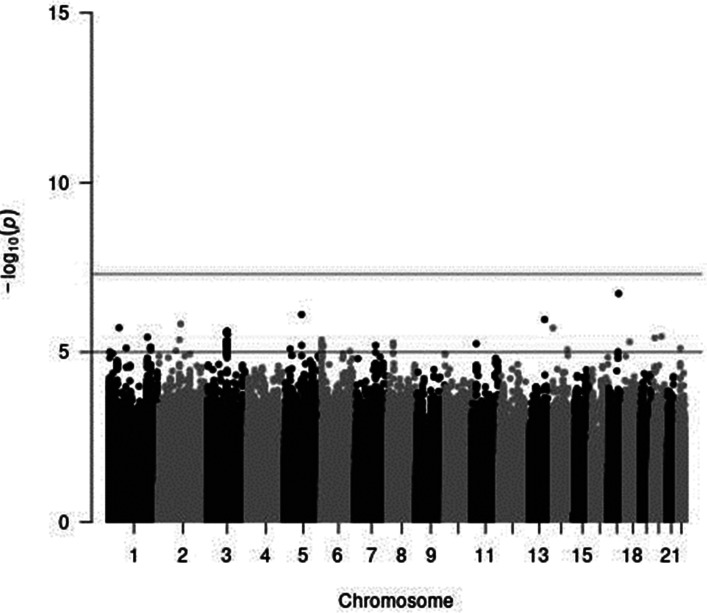
Fig. 2.
A Manhattan plot of the results from the GWAS of meat intake (g/1000 kcal per d). The x-axis indicates chromosomal positions, and the y-axis represents −log10 P-values obtained by linear model association analysis. The software qqman was used(38). Chromosomal position (GRCh37/hg19).

