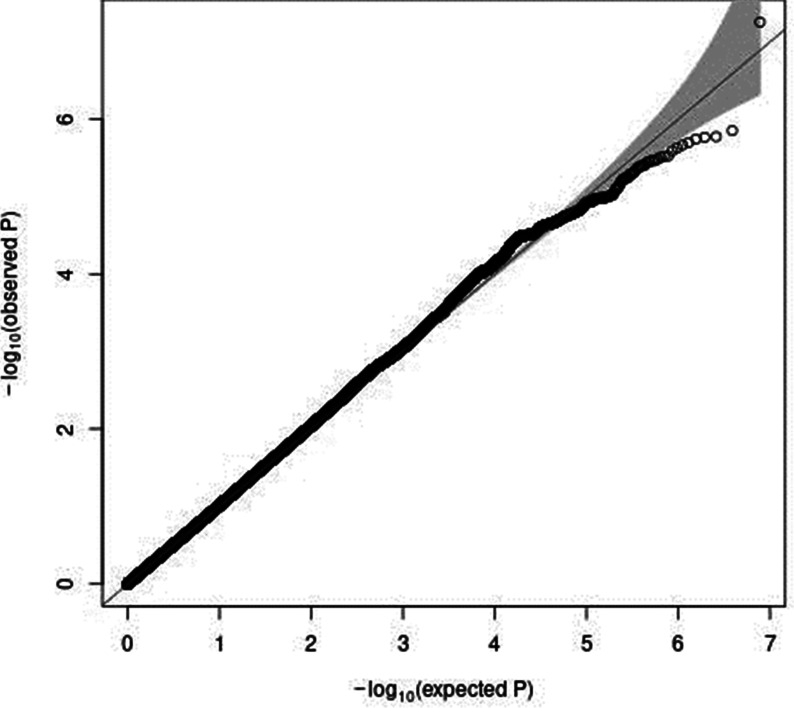
Fig. 3.
A Q–Q plot (black) for the sex-stratified GWAS of meat intake (g/1000 kcal per d) in women. The x-axis shows the expected −log10 P-values under the null hypothesis. The y-axis expresses the observed −log10 P-values obtained by a linear regression model using PLINK(27,28). The line represents y = x, which corresponds to the null hypothesis. The grey shaded area expresses the 95 % CI of the null hypothesis. The inflation factor (λ) is the median of the observed test statistics divided by the median of the expected test statistics. An R package for creating the Q–Q plot, GWAS tools, was used(37). Chromosomal position (GRCh37/hg19).

