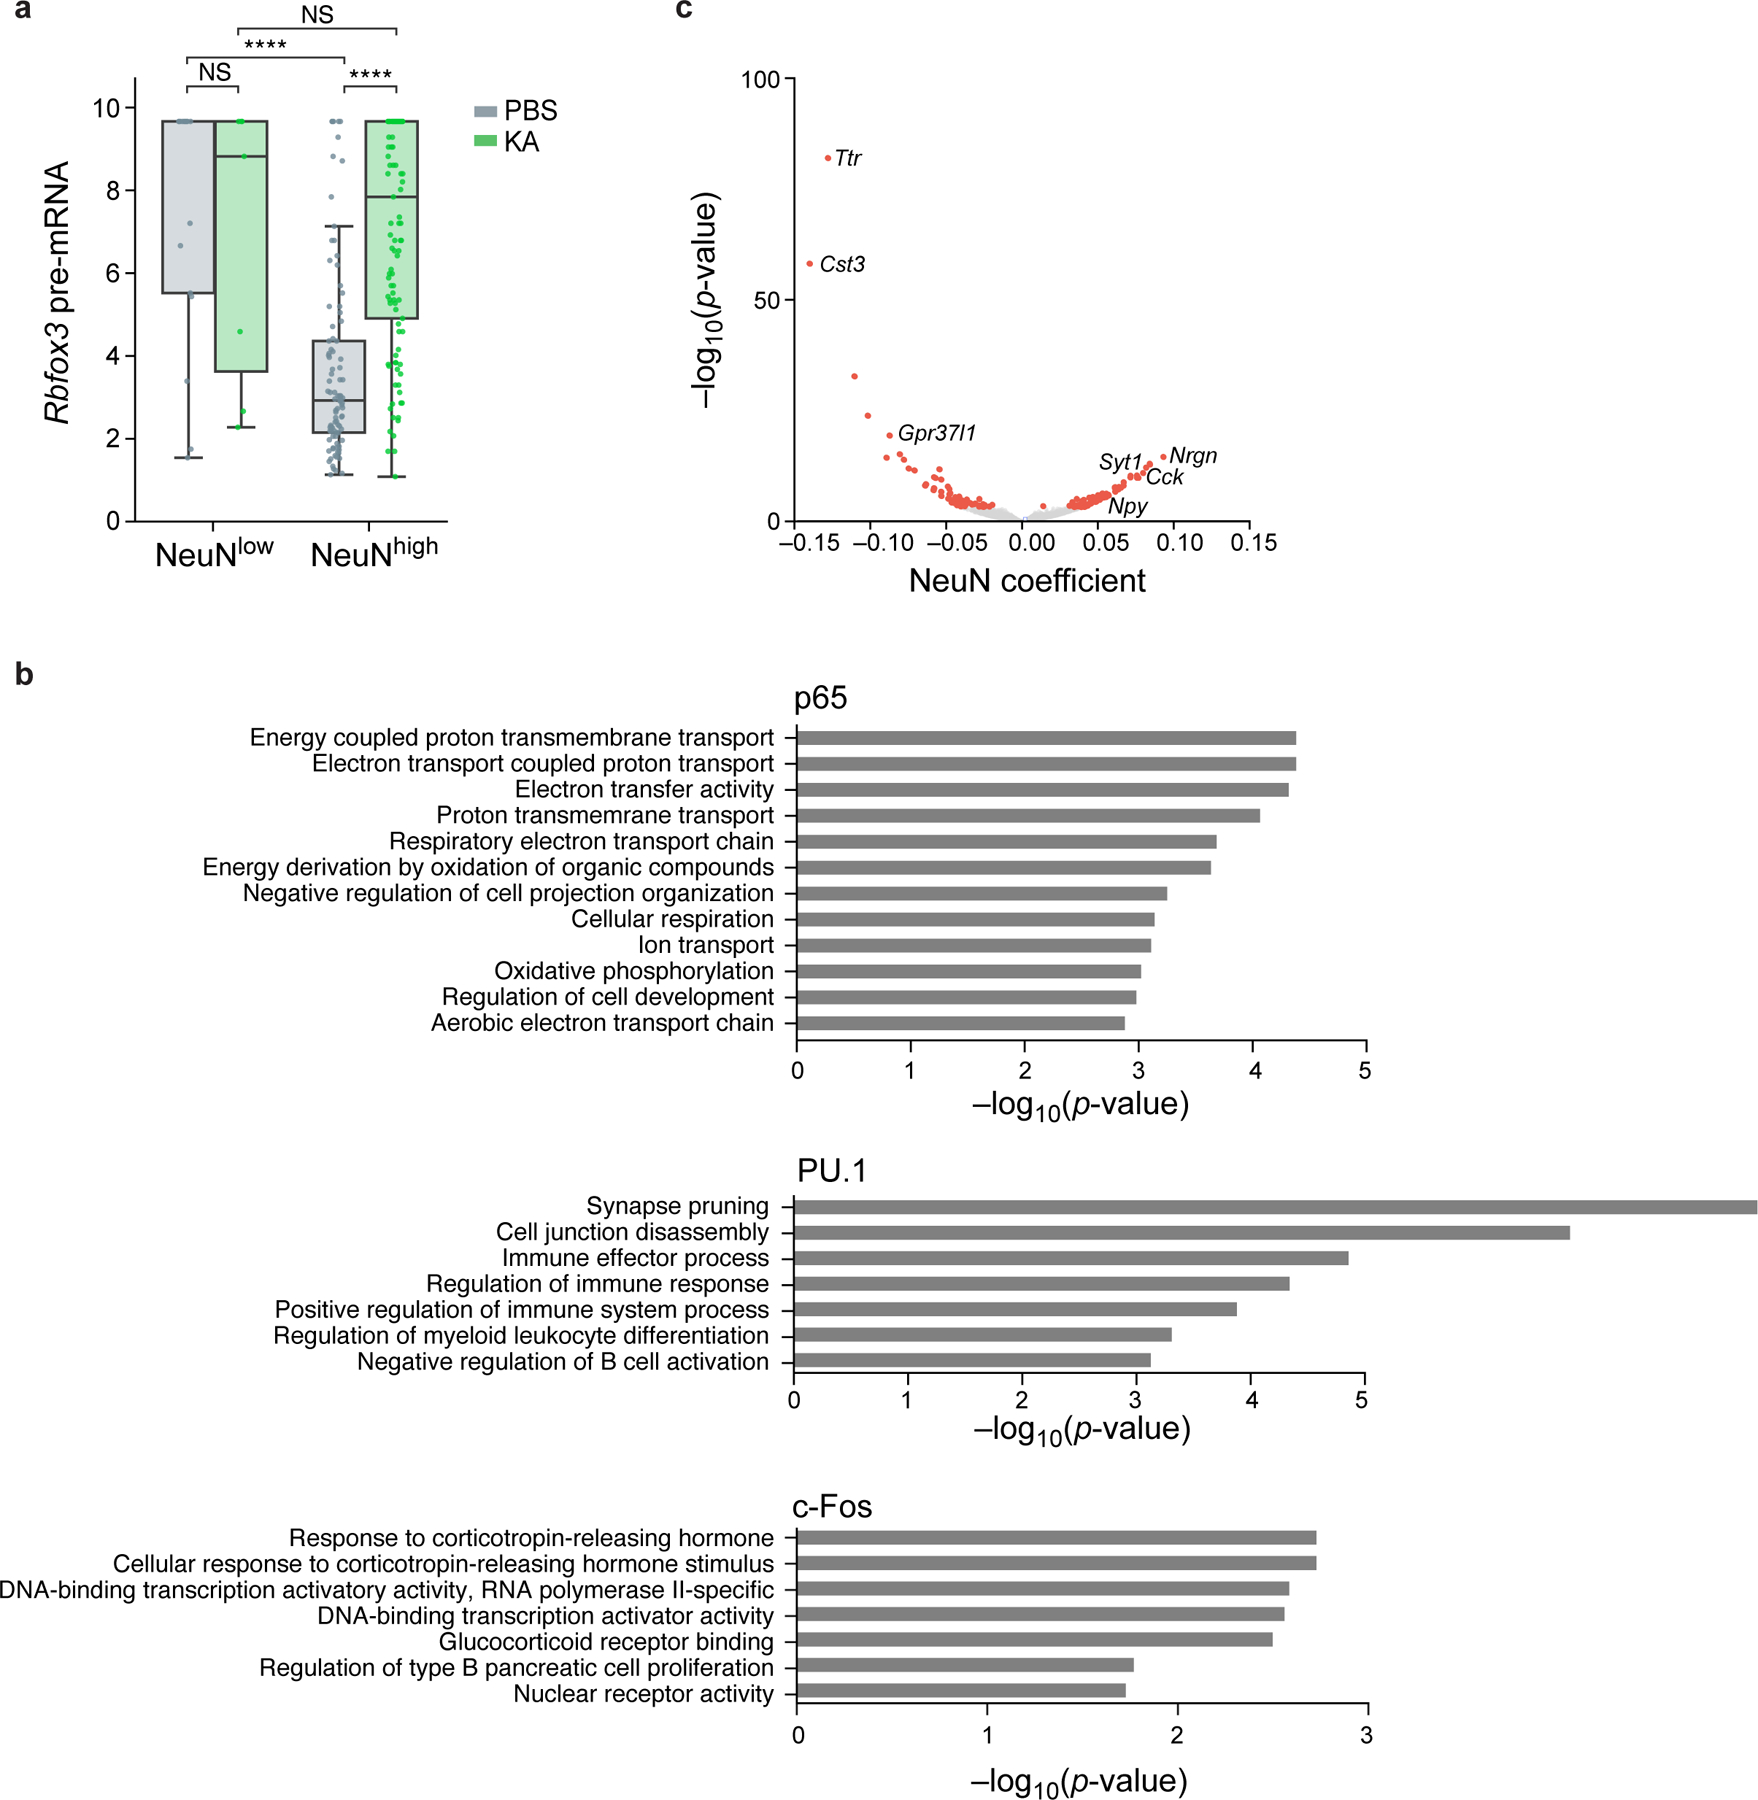
Extended Data Fig. 7. Protein effects on global gene expression.

a. Relation between unspliced pre-mRNA expression of Rbfox3 and nuclear protein levels of NeuN. Distribution of pre-mRNA levels (Z score of log-normalized counts, y axis) in nuclei with high or low levels of NeuN (x axis) after PBS (gray) or KA (green) treatment (NeuN thresholds in Extended Data Fig. 6). Boxplots show the median (centre line), box bounds represent first and third quartiles, and whiskers span from each quartile to the minimum or the maximum (1.5 interquartile range below 25% or above 75% quartiles). Dots correspond to 227 individual nuclei with non-zero pre-mRNA levels measured across n=2 biologically independent samples. Significance, from left: P=5*10−15, P=9*10−5 two-sided Mann-Whitney test. NS – not significant. b. Functional gene sets enriched in TF associated genes. Enrichment (−log10(P-value), x axis, hypergeometric test) of Gene Ontology (GO) terms (y axis) in genes significantly associated (from top to bottom) with p65 (33 genes), PU.1 (13 genes), and c-Fos (10 genes). c. Genes associated with NeuN. Effect size (x axis) and associated significance (y axis, −log10(P-value)) for the association of each gene (dots) with NeuN by a model of gene expression as a linear combination of the four inCITE-seq target proteins after regressing out treatment and cell type (Methods). Select genes are labeled. Colored dots: Benjamini-Hochberg FDR <5%.
