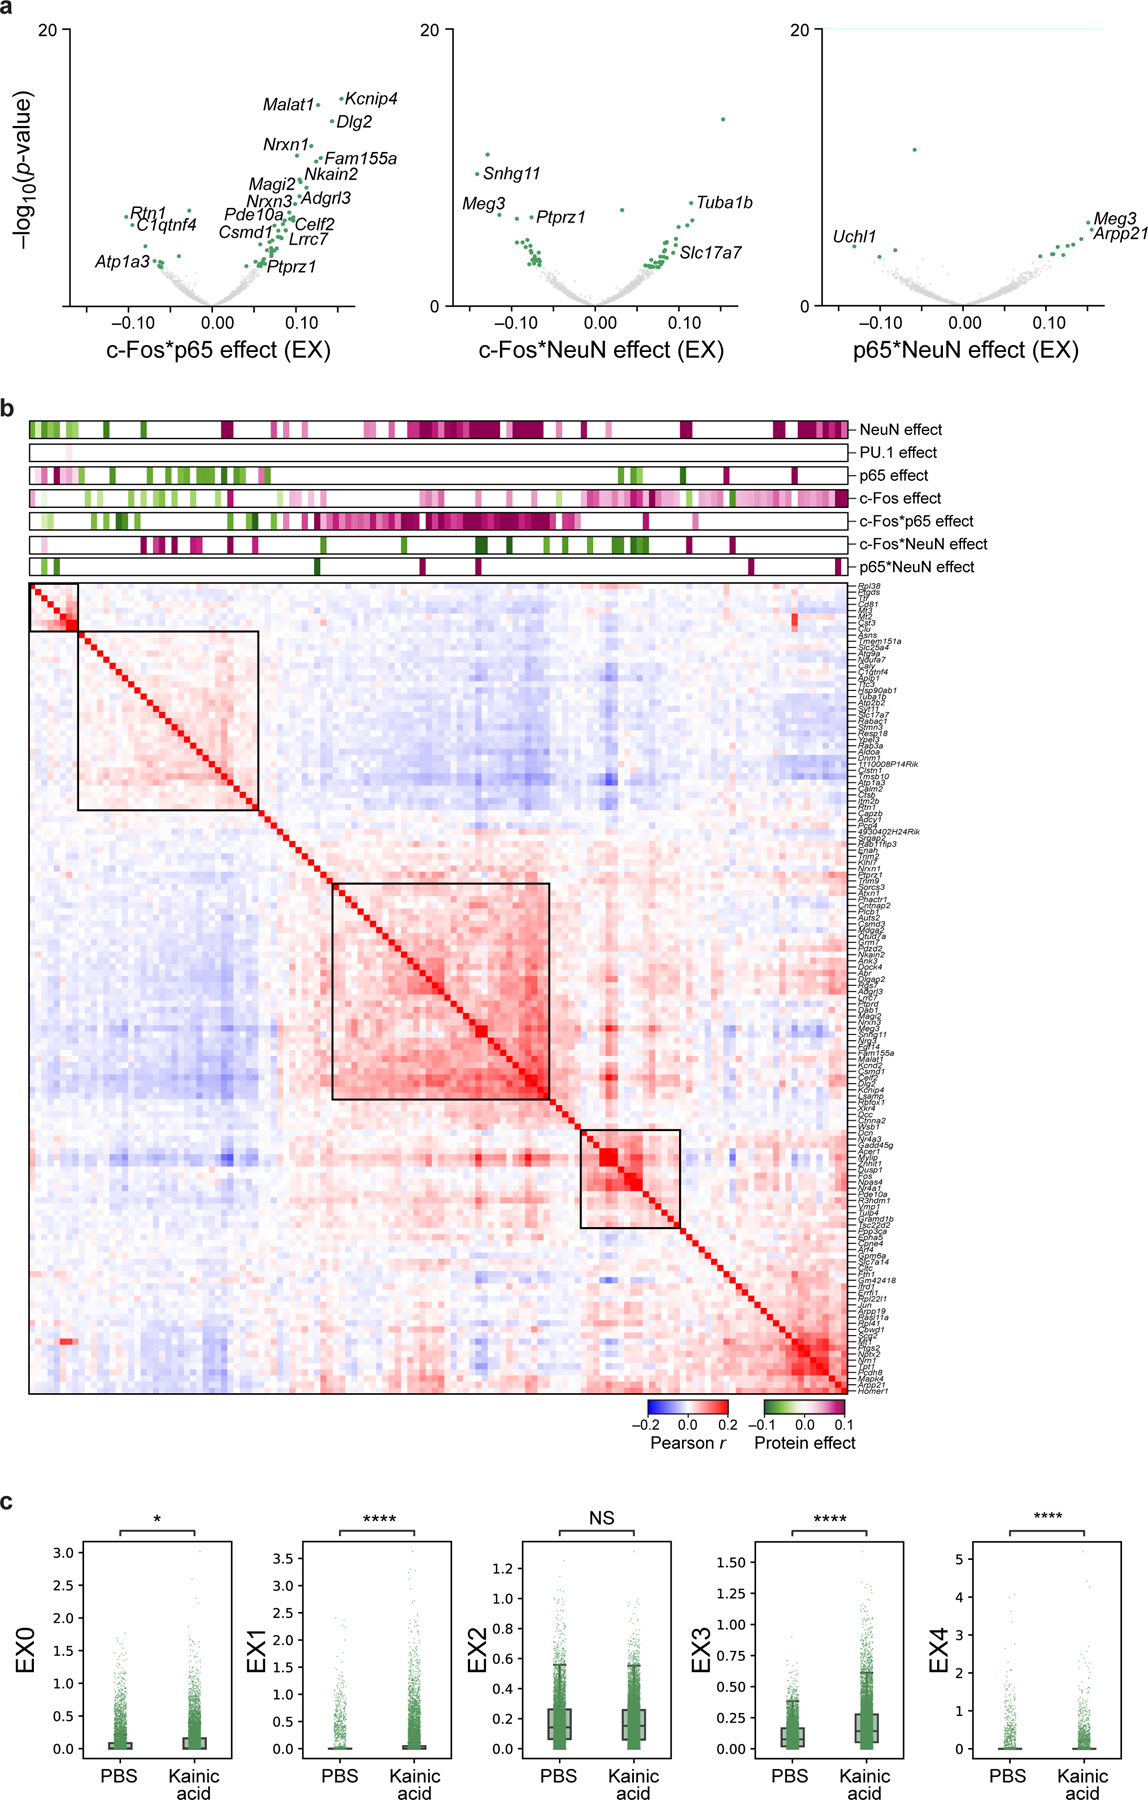
Extended Data Fig. 8. Genes and modules associated with TFs within excitatory (EX) neurons.

a. Genes associated with protein-protein pairs in the interaction model, identified by modeling gene expression across excitatory neurons as a linear combination of individual proteins and their pairwise interactions after regressing out treatment. Effect size (x axis) and significance (y axis, −log10(P-value)) for DEGs (dots) associated with each protein-protein interaction term: p65 and c-Fos (left), c-Fos and NeuN (middle), and p65 and NeuN (right). Select genes are labeled. Colored dots: Benjamini-Hochberg FDR<5%. b. Pearson correlation coefficient (red/blue colorbar) of pairwise gene expression profiles (rows and columns) significantly (FDR<5%) associated positively (purple) or negatively (green), with c-Fos (additive model), p65 (additive model), or c-Fos*p65 (interaction model), ordered by hierarchical clustering. Top bars: Effect size of each protein or protein-protein pair. c. Treatment effect on gene programs. Program scores (y axis) for 5 EX programs (in Fig. 4f) of 15,226 individual nuclei (dots) from PBS or KA treated mice (x axis) measured across 2 biologically independent experiments. Boxplots show the median (centre line), box bounds represent first and third quartiles, and whiskers span from each quartile to the minimum or the maximum (1.5 interquartile range below 25% or above 75% quartiles). Significance, from left: P=0.049, P=2.7*10−271, P=2.2*10−199, P=6.1*10−7, two-sided Mann-Whitney test. NS – not significant.
