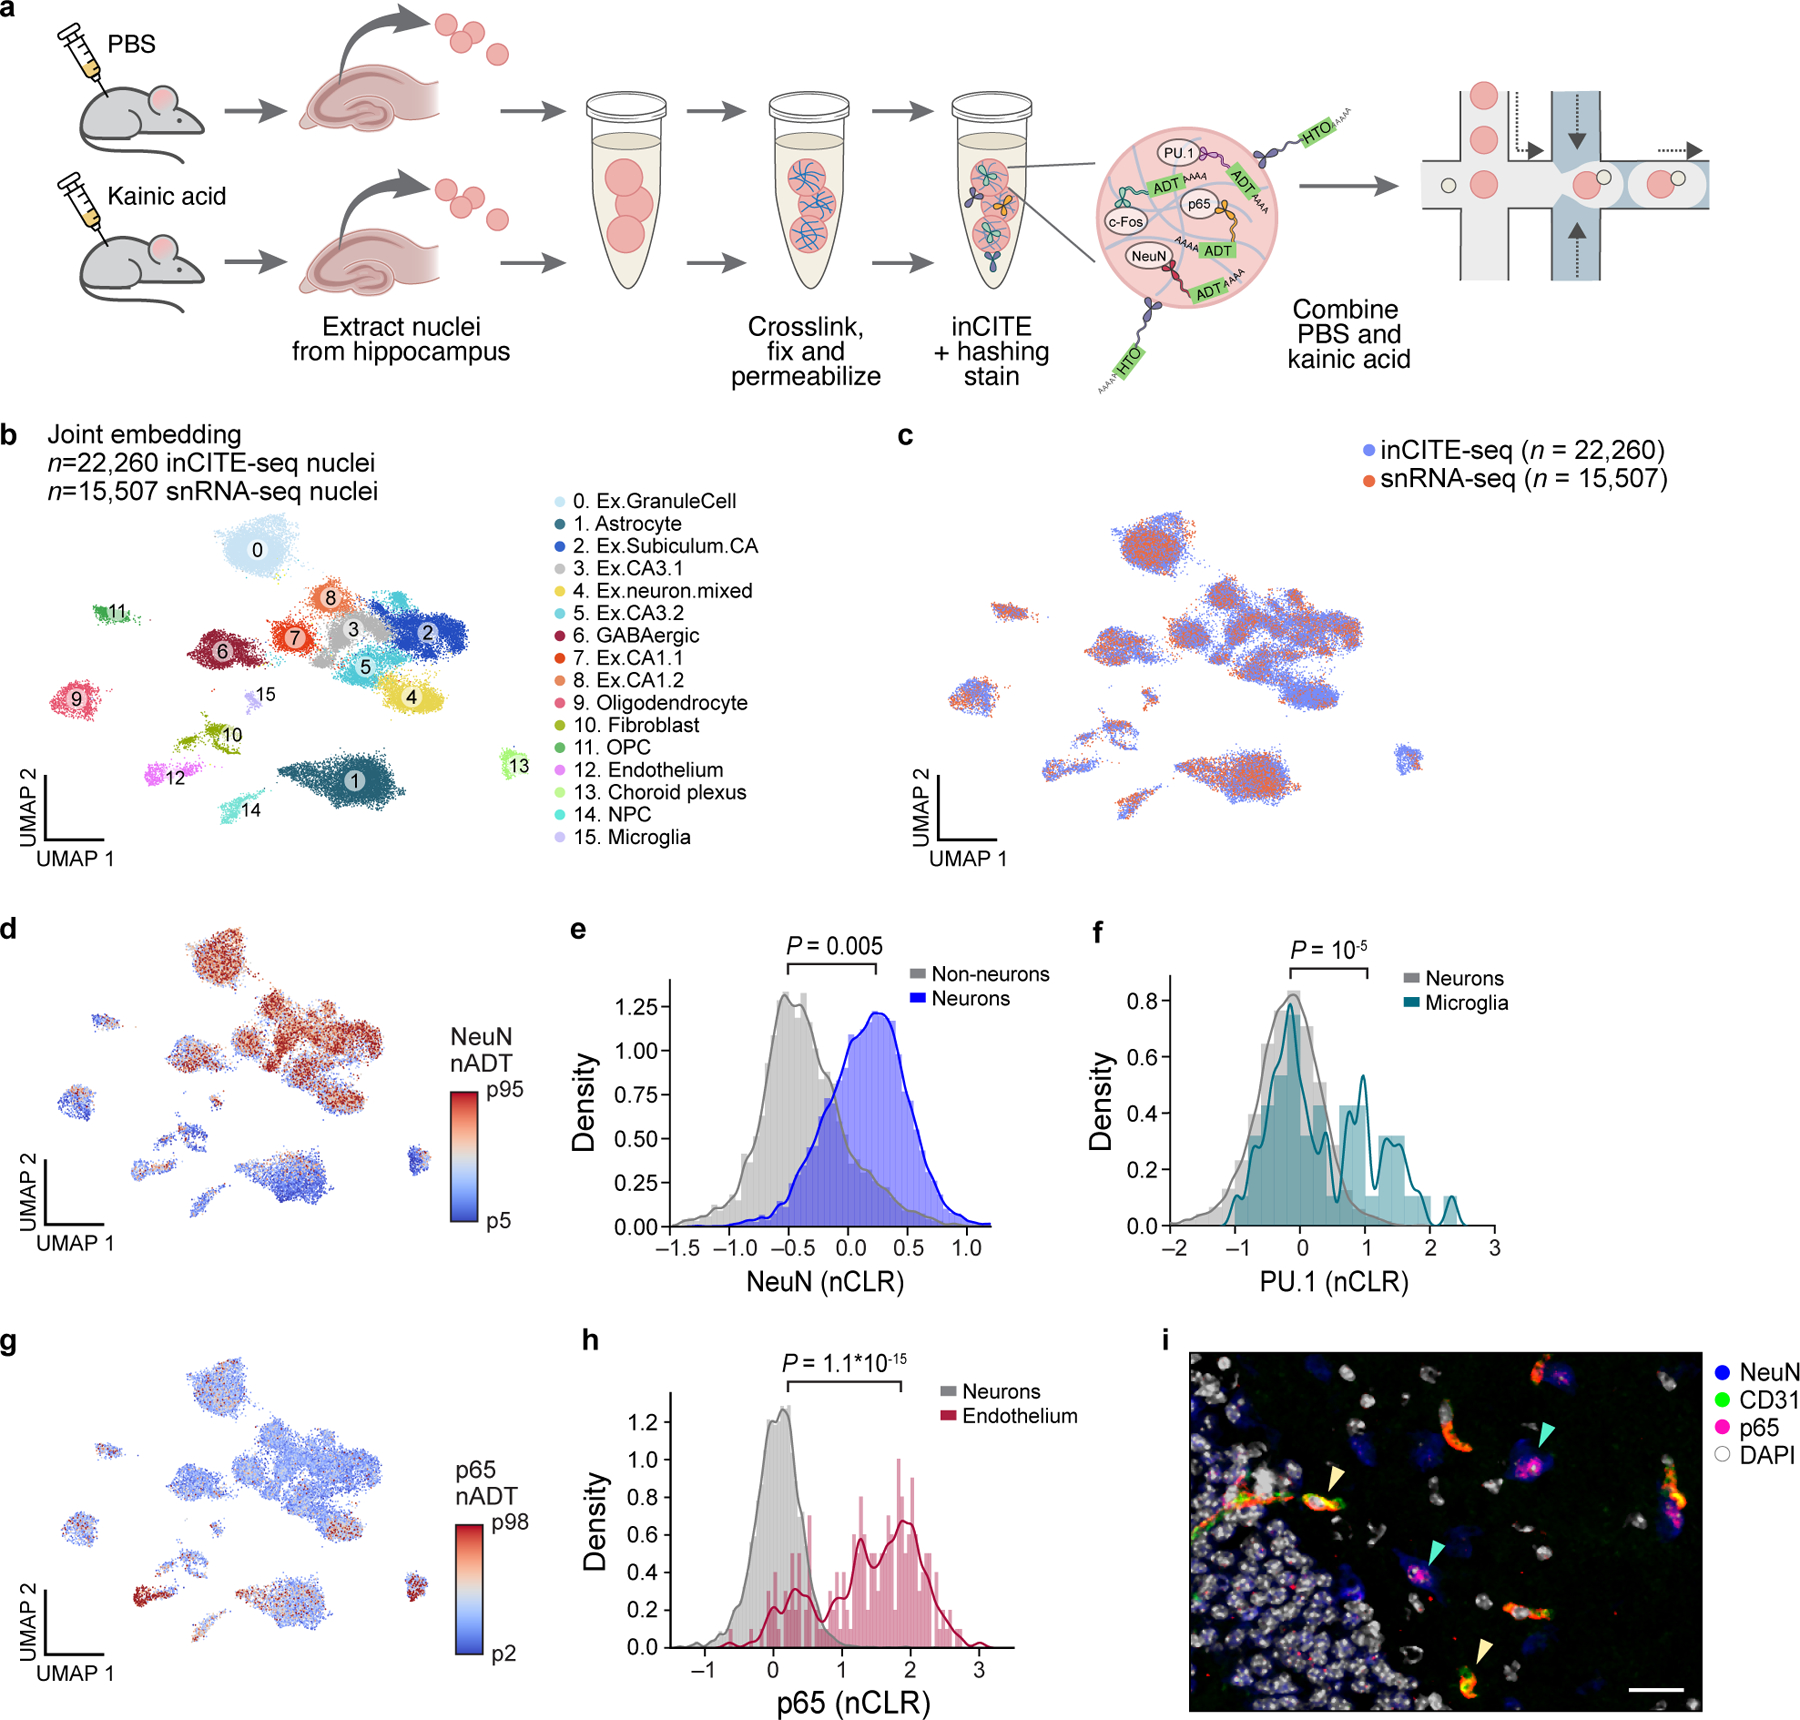
Figure 2. In vivo application of inCITE-seq shows cell type-specific protein expression in the mouse hippocampus.

a. InCITE-seq of the mouse hippocampus after kainic acid or PBS (control) treatment, with nucleus hashing. b. Cell types from the adult mouse hippocampus identified by joint embedding of inCITE-seq and snRNA-seq. UMAP embedding of single nucleus RNA profiles from two batches of inCITE-seq (n=22,260) and two snRNA-seq experiments (this study and Habib et al.54, n=15,507) of the mouse hippocampus, after regressing out treatment and batch (Methods), colored by cluster and annotated post hoc (color legend). “Ex”: excitatory neurons clusters. c. Integration of inCITE-seq and snRNA-seq profiles. UMAP embedding as in (b), colored by assay type (inCITE-seq, blue; snRNA-seq, pink). d,g. UMAP embeddings as in (b), but showing only inCITE-seq nuclei profiles colored by protein levels (nADT) for NeuN (d, 5th to 95th percentile) and p65 (g, color scale from 2th to 98th percentile). e,f,h. Distribution of protein levels (nCLR, x axis) for NeuN in neuronal (blue) and non-neuronal (gray) nuclei (e; P=0.005, two-sided KS test), PU.1 in microglial (turquoise) and neuronal (gray) nuclei (f; P=10−5, two-sided KS test), and p65 in endothelial (fuchsia) and neuronal (gray) nuclei (h; P=1.1*10−15, two-sided KS test), from one batch. Curve: kernel density estimate. i. Immunofluorescence stain of the hippocampus with endothelial marker CD31 (green), NeuN (blue), p65 (pink), and DAPI (white); representative of 3 independently conducted experiments. Yellow arrowheads: co-localization of CD31 and p65. Green arrowheads: lowly expressed p65 in neurons. Scale bar, 50μm.
