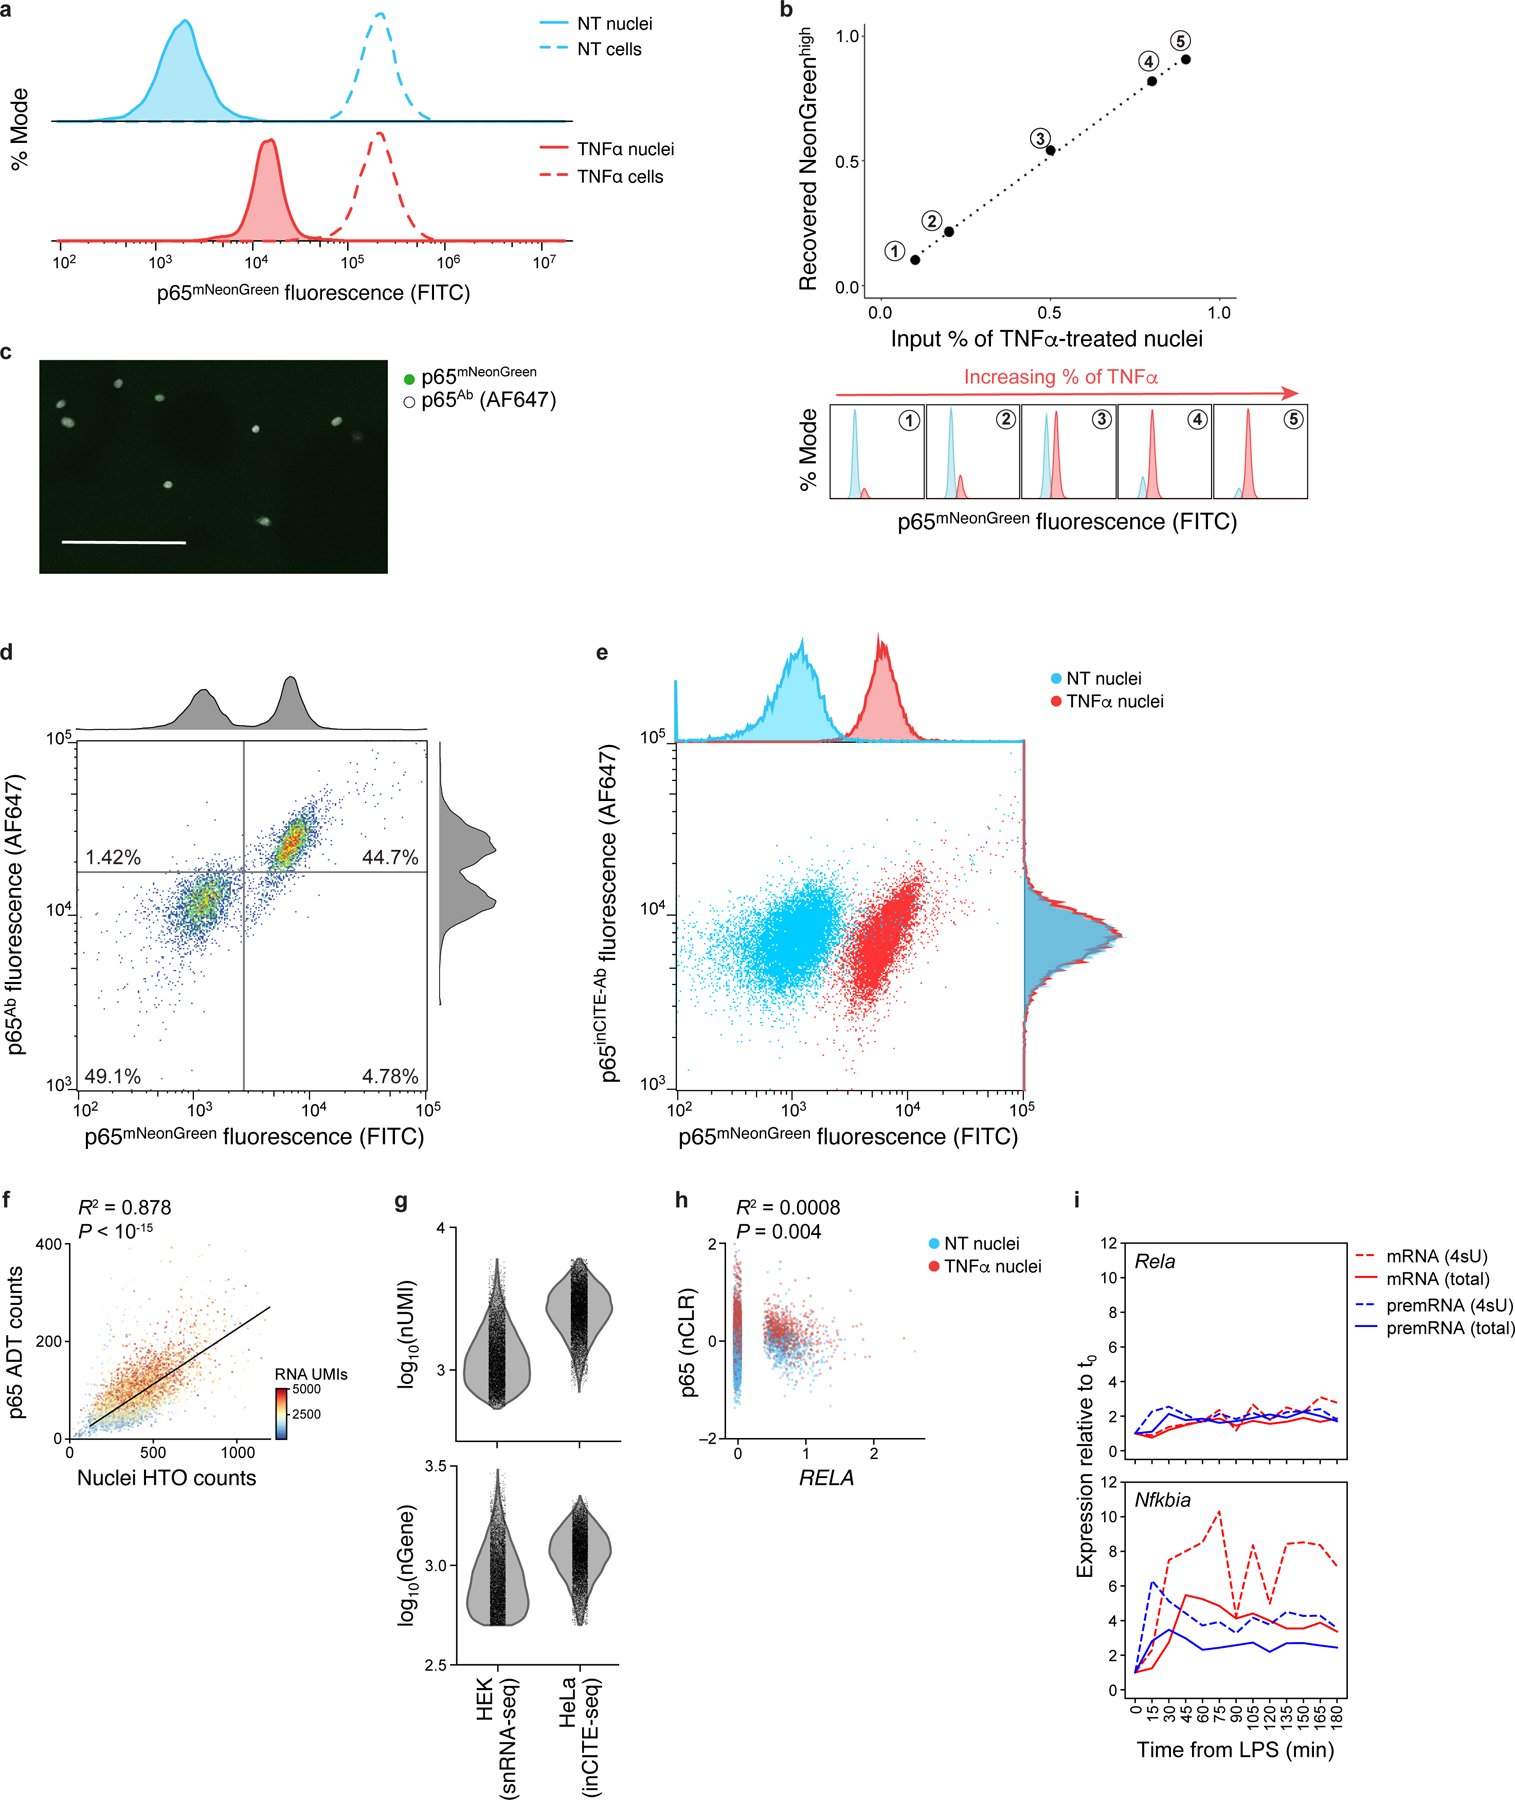
Extended Data Fig. 1. Optimization of intranuclear antibody staining in HeLa cells.

a. Nuclear p65 levels change after TNFα treatment, while total p65 in cells remains unchanged. Distribution of p65-mNeonGreen reporter fluorescence (x axis; % mode of singlet nuclei, y axis) measured by flow cytometry of nuclei (solid line) vs. cells (dashed line) from untreated (“NT”, blue) or TNFα treated cells (red). b. Flow cytometry distinguishes p65-mNeonGreen signals across mixtures of NT and TNFα. Top: Flow cytometry measures of mNeonGreenhigh fraction (x axis) match the input fraction of TNFα nuclei (x axis). Bottom: Corresponding high (red) and low (blue) mNeonGreen distributions. c. Immunofluorescence of nuclei smeared onto a slide after intranuclear p65 stain in suspension, showing complete antibody diffusion into the nucleus; representative of 3 experiments. Scale: 100μm. d,e. Comparing antibody- and fluorescence reporter-derived p65 levels. Antibody (from Alexa Fluor 647 secondary, y axis) and mNeonGreen (x axis) signal of p65 in an equal mixture of NT and TNFα stimulated nuclei. Histograms: marginal distributions. d. Agreement between unconjugated p65 antibody and mNeonGreen signal. e. No relationship between DNA-conjugated p65inCITE-Ab and mNeonGreen signal using standard intranuclear staining buffer (pre-optimization). f. Relation between nuclei hashtag oligonucleotide (HTO; x axis) counts and p65 antibody-derived tag (ADT; y axis) counts, shown across 10,014 NT and TNFα nuclei, colored by the number of RNA UMIs. Top left: Pearson R2 and associated P-value (two-sided t-test). To control for this relation, we normalize protein ADT counts by nuclei HTO counts (Methods). g. Comparing RNA complexity from inCITE-seq (fixed HeLa nuclei) and MULTI-seq (unfixed HEK nuclei, from McGinnis et al.45) by the distribution of the number of detected transcripts (UMIs; top) and genes (bottom). h. Low correlation between p65 protein (y axis, nCLR) and RELA RNA levels (x axis, log normalized), with Pearson R2 and associated P-value (two-sided t-test). Dots: nuclei colored by treatment (NT, blue; TNFα, red). i. Dynamics of gene expression after LPS stimulation in mouse dendritic cells, from Rabani et al.10, measured across time (x axis). Relative expression to steady state, t0 (y axis): pre-mRNA precursor (blue) and mRNA (red) for total (solid) vs. 4sU labeled (dashed) RNA, shown for Rela (top) and Nfkbia (bottom), a p65 target as in Fig. 1e.
