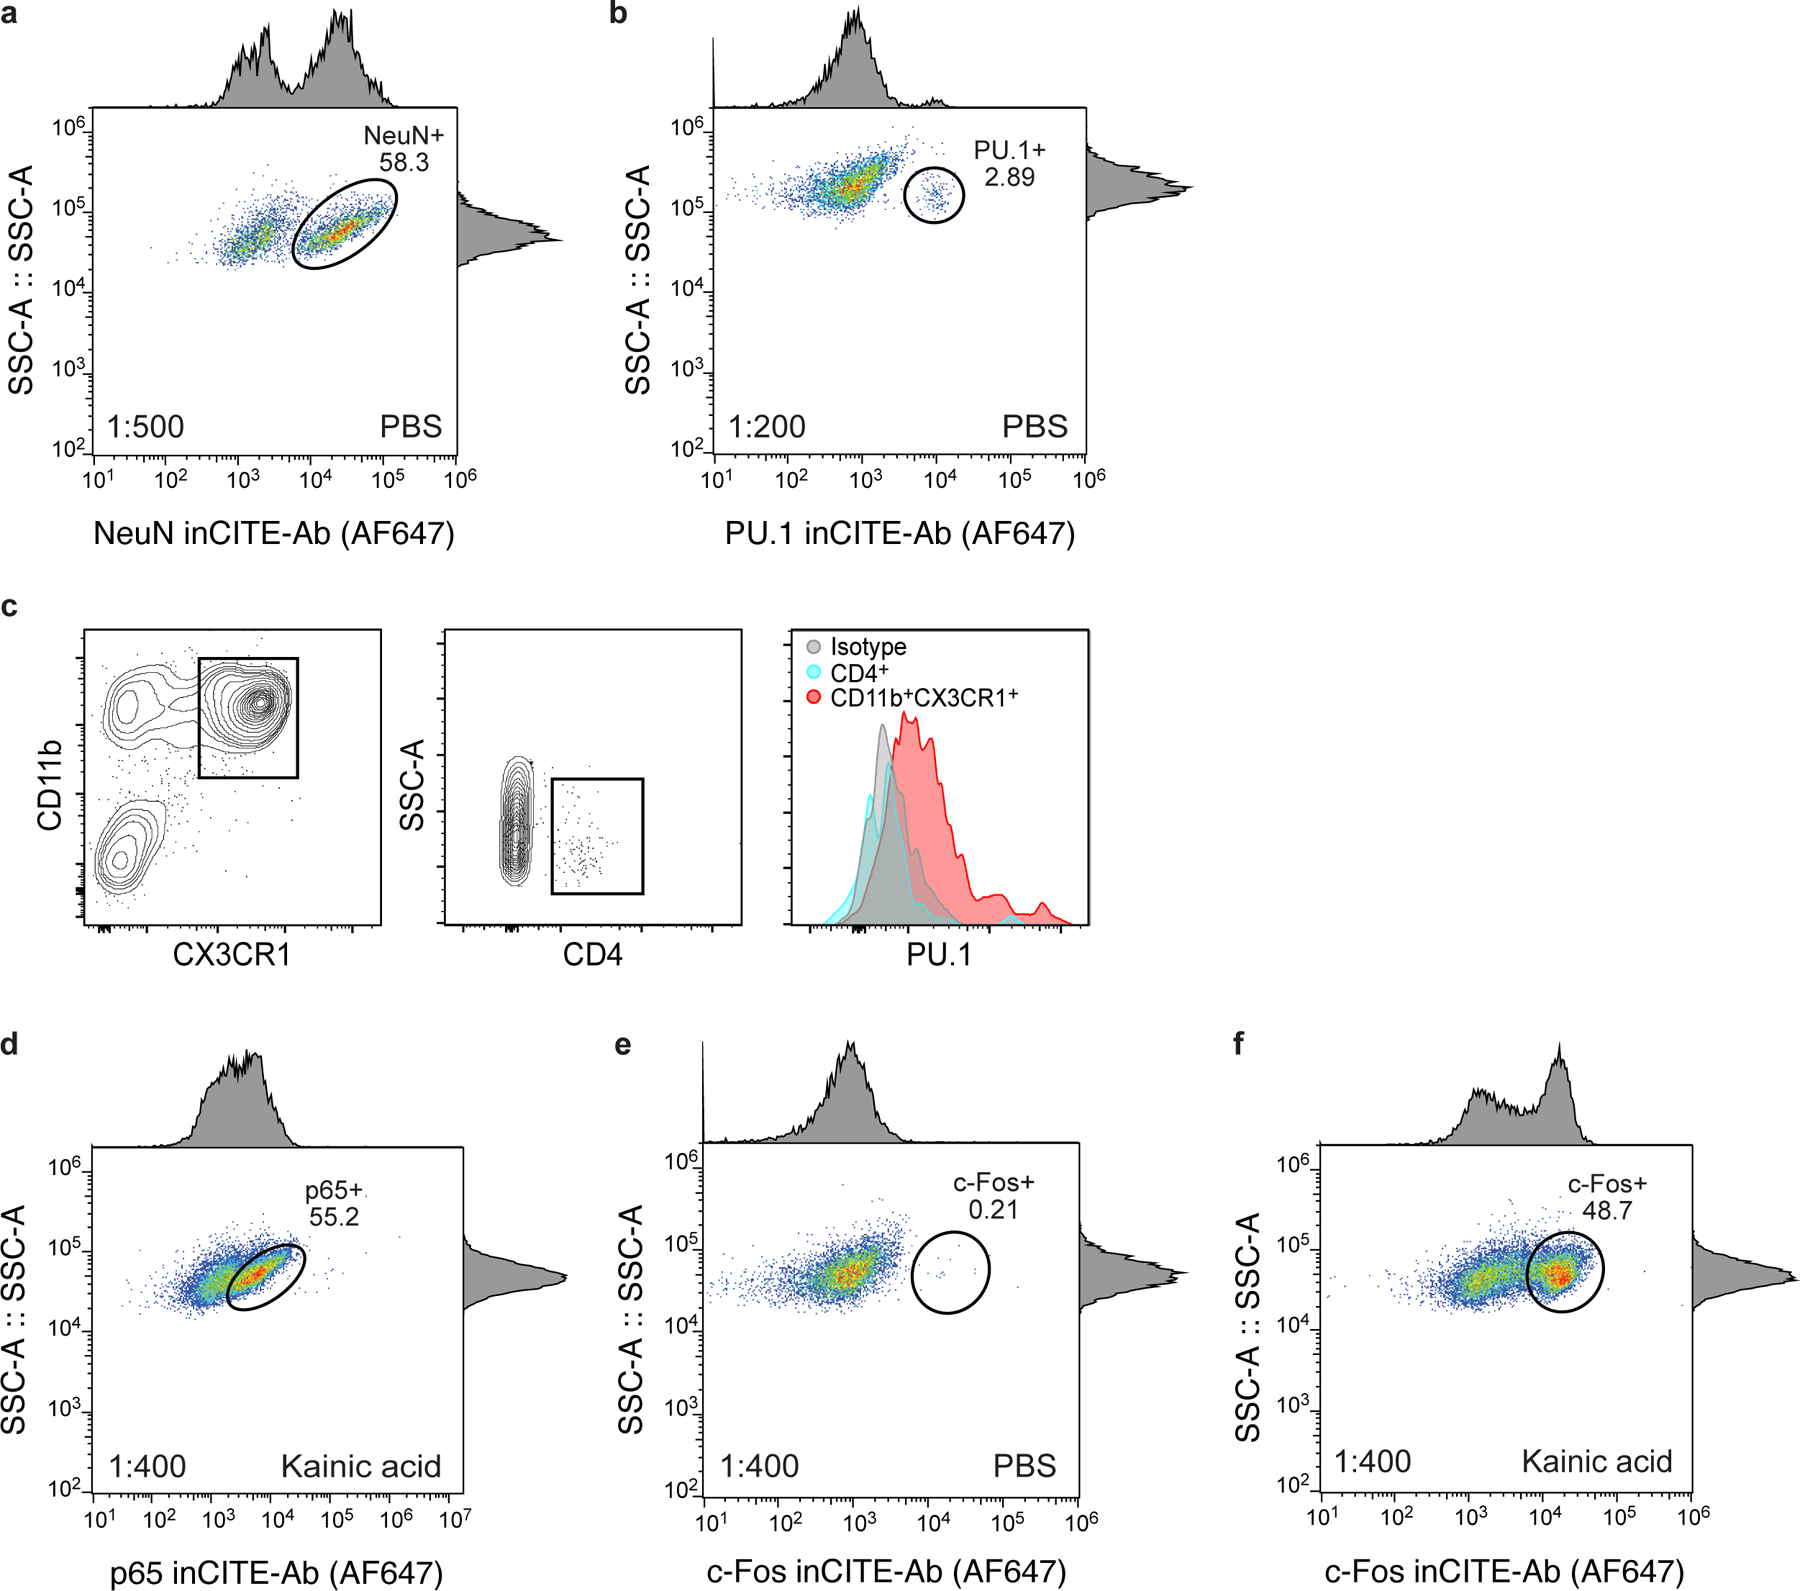
Extended Data Fig. 2. Flow cytometry of inCITE targets on nuclei or cells extracted from frozen mouse hippocampus.

Flow cytometry of nuclei populations from the mouse hippocampus after intranuclear stains with inCITE antibodies, followed by Alexa Fluor 647-conjugated secondary stain: NeuN in PBS (a), PU.1 in PBS (b), p65 in kainic acid (KA) (d), and c-Fos in PBS (e) and kainic acid (KA) (f) treated mice. Axes show fluorescence signal (x axis) and side scatter (y axis) of singlet nuclei (dots); histograms show marginal distributions. Oval gates show NeuNhigh (a, 58.3%), PU.1high (b, <3%), p65high (d, 55.2%), c-Foshigh (0.21% in PBS (e), and 48.7% after KA treatment (f)). c. Right: Distribution of PU.1 in microglia (CD11b+ CX3CR1+, red), CD4+ cells (blue) and isotype (gray) cells measured by flow cytometry (left and middle panels) after simultaneous surface protein and intracellular protein stains (Methods).
