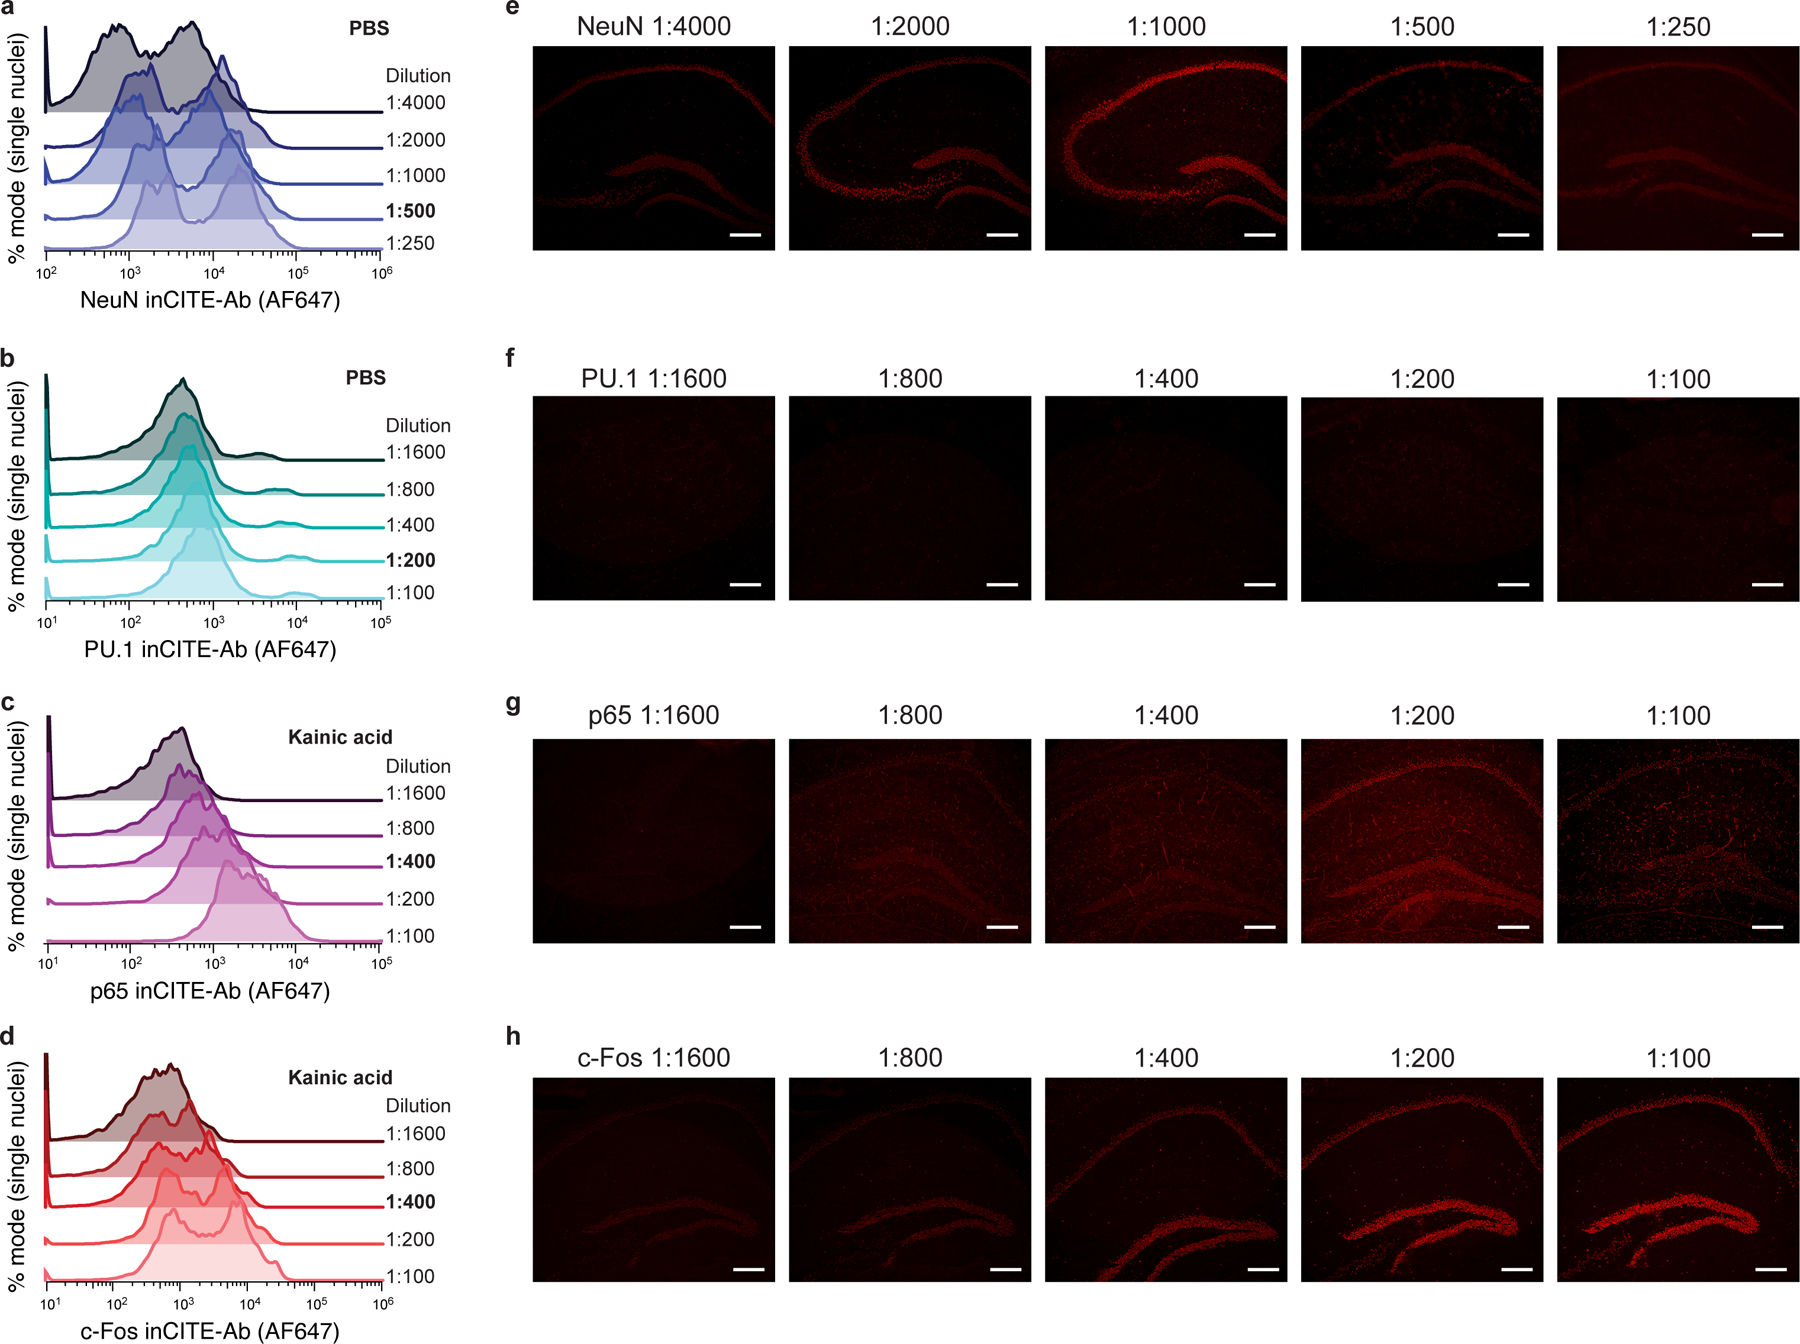
Extended Data Fig. 3. Antibody signal varies across concentration regimes.

Antibody stains of the mouse hippocampus (extracted nuclei or in situ) with inCITE antibodies across a wide range of dilutions, targeting NeuN in PBS (a,e), PU.1 in PBS (b,f), p65 in kainic acid (c,g), and c-Fos in kainic acid (d,h) treated mice. Antibody-derived fluorescence measured by Alexa Fluor 647-conjugated secondary antibody stain. a-d. Histograms are normalized as % mode of nuclei singlets. Antibody dilutions are indicated to the right of each axis, with dilutions used for inCITE-seq in bold (NeuN 1:500, PU.1 1:200, p65 1:400, c-Fos 1:400). e-h. In situ immunofluorescence of frozen mouse hippocampus with inCITE antibodies across different dilutions, matching the concentrations used in flow cytometry; representative of 2 independently conducted experiments. Scale bars, 100μm.
