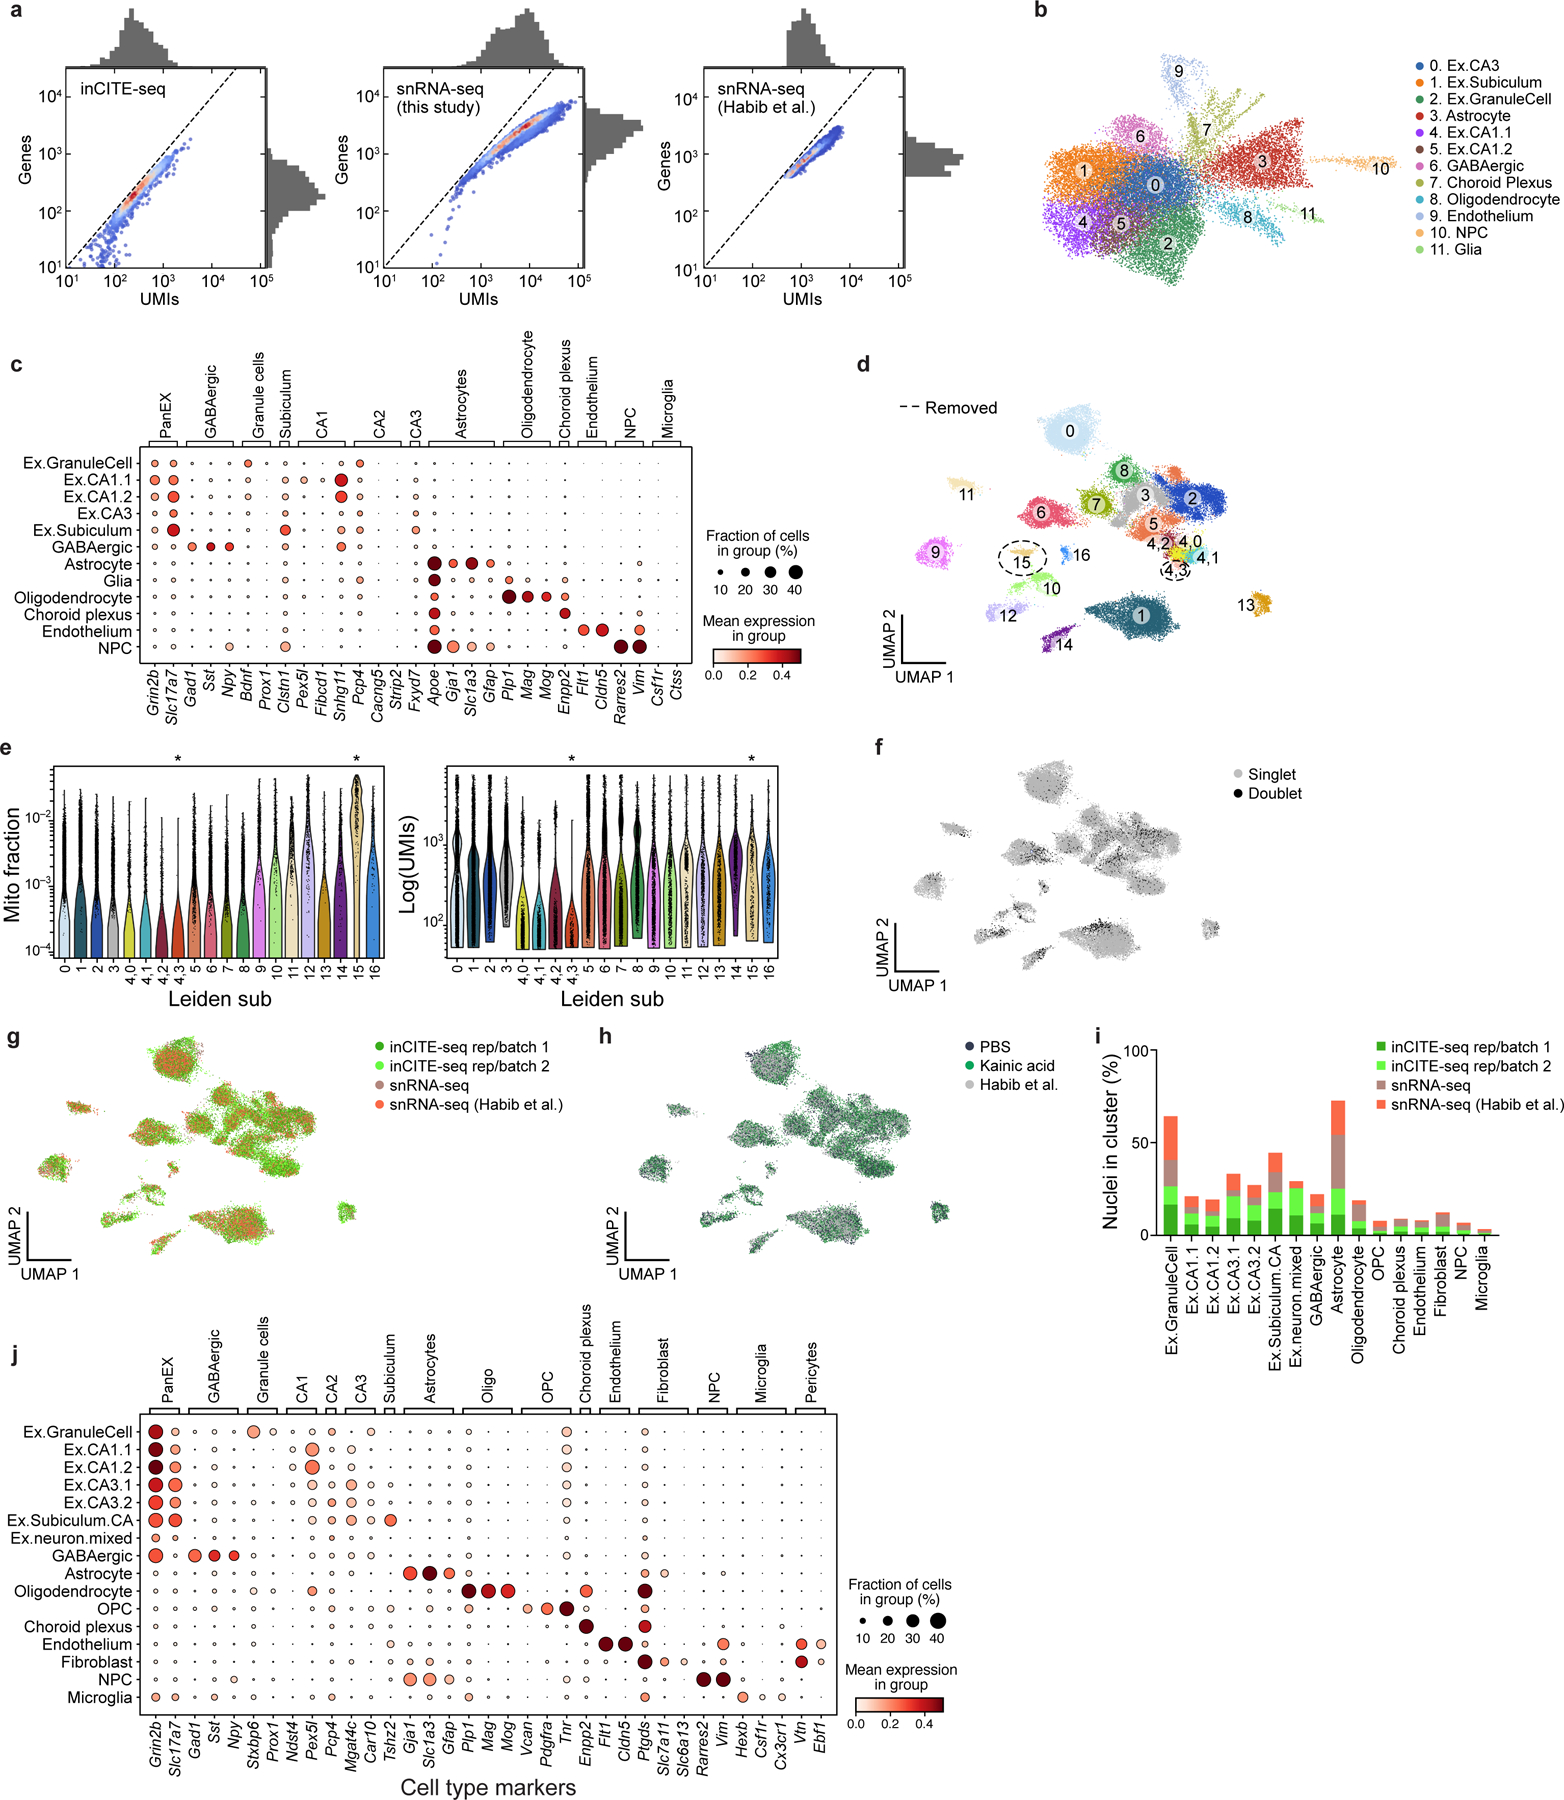
Extended Data Fig. 5. Comparing and combining single nucleus RNA profiles from inCITE-seq and snRNA-seq of mouse hippocampus.

a. Comparing the complexity of RNA profiles from inCITE-seq and standard snRNA-seq of the mouse hippocampus. Distributions (marginals) of the number of UMIs (x axis) and genes (y axis) from inCITE-seq (left), matching mouse hippocampus snRNA-seq in this study (middle), and previously published snRNA-seq (right). Scatter plot shows the density of individual nuclei (dots) calculated with a Gaussian kernel estimate. b,c. Major cell types from the adult mouse hippocampus identified from inCITE-seq RNA profiles alone. b. UMAP embedding of 24,444 single nucleus inCITE-seq RNA profiles (dots) colored by annotated cluster (number). c. Expression of marker genes (columns) used for annotating cell type clusters (rows), showing mean expression of log normalized counts (dot color) and proportion of expressing cells (dot size). d-j. Enhanced cell type distinctions and annotation by combining RNA profiles from inCITE-seq and snRNA-seq. Joint UMAP embedding of 22,260 inCITE-seq and 15,507 snRNA-seq RNA profiles (dots) colored by unsupervised leiden clusters or subcluster of leiden group 4 (numbers) (Methods). e. Distribution of mitochondrial fraction of total gene content (y axis, left) and total transcript counts (y axis, right) in each leiden cluster or subcluster of leiden group 4 (x axis, both). Asterisks indicate cluster 15 (n=327 nuclei) and subcluster 4,3 (n=179 nuclei) that were removed for high mitochondrial content and for low RNA complexity, respectively. f-h. UMAP embedding as in Fig. 2d colored by doublets that were removed from subsequent analyses (n=3,059 doublets, (f)), batch and assay (g), or condition (h). i. Percent of nuclei (y axis) from each batch/assay (color) in each cluster (x axis). j. Mean expression of log normalized counts (dot color) and proportion of expressing cells (dot size) of marker genes (columns) used for annotating cell type clusters in d (rows).
