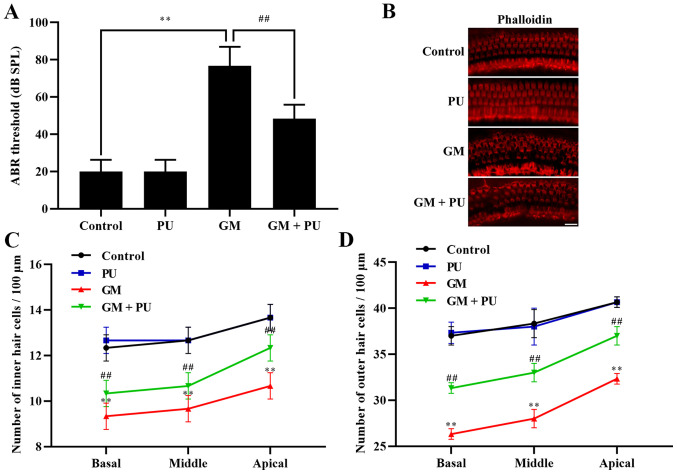
Figure 1.
Effects of PU and GM in C57BL/6J mice. (A) Statistical analysis of ABR threshold. n=6. **P<0.01 GM group vs. control group; ##P<0.01 GM + PU group vs. GM group. (B) Image of basilar membrane stained with phalloidin. Scale bar, 20 µm. (C and D) Statistical analysis of the surviving outer and inner hair cells in the four groups. n=6. **P<0.01 GM group vs. control group; ##P<0.01 GM + PU group vs. GM group. PU, puerarin; GM, gentamicin; ABR, auditory brainstem response.

