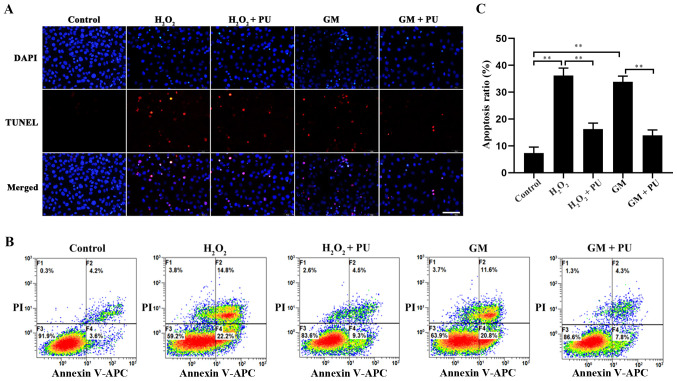
Figure 5.
Rate of apoptosis after different treatments as determined by TUNEL assay and flow cytometry. (A) Image of HEI-OC1 cells stained with TUNEL staining. Nuclei were stained with DAPI (blue) and HEI-OC1 cells were stained with TUNEL (red). Scale bar, 100 µm. (B) Flow cytometry was used to assess apoptosis after treatment under different conditions for 24 h. (C) The apoptotic rate of the cells was statistically analysed. n=6. **P<0.01. PU, puerarin; GM, gentamicin; HEI-OC1, House Ear Institute-Organ of Corti 1.

