
Figure 5.
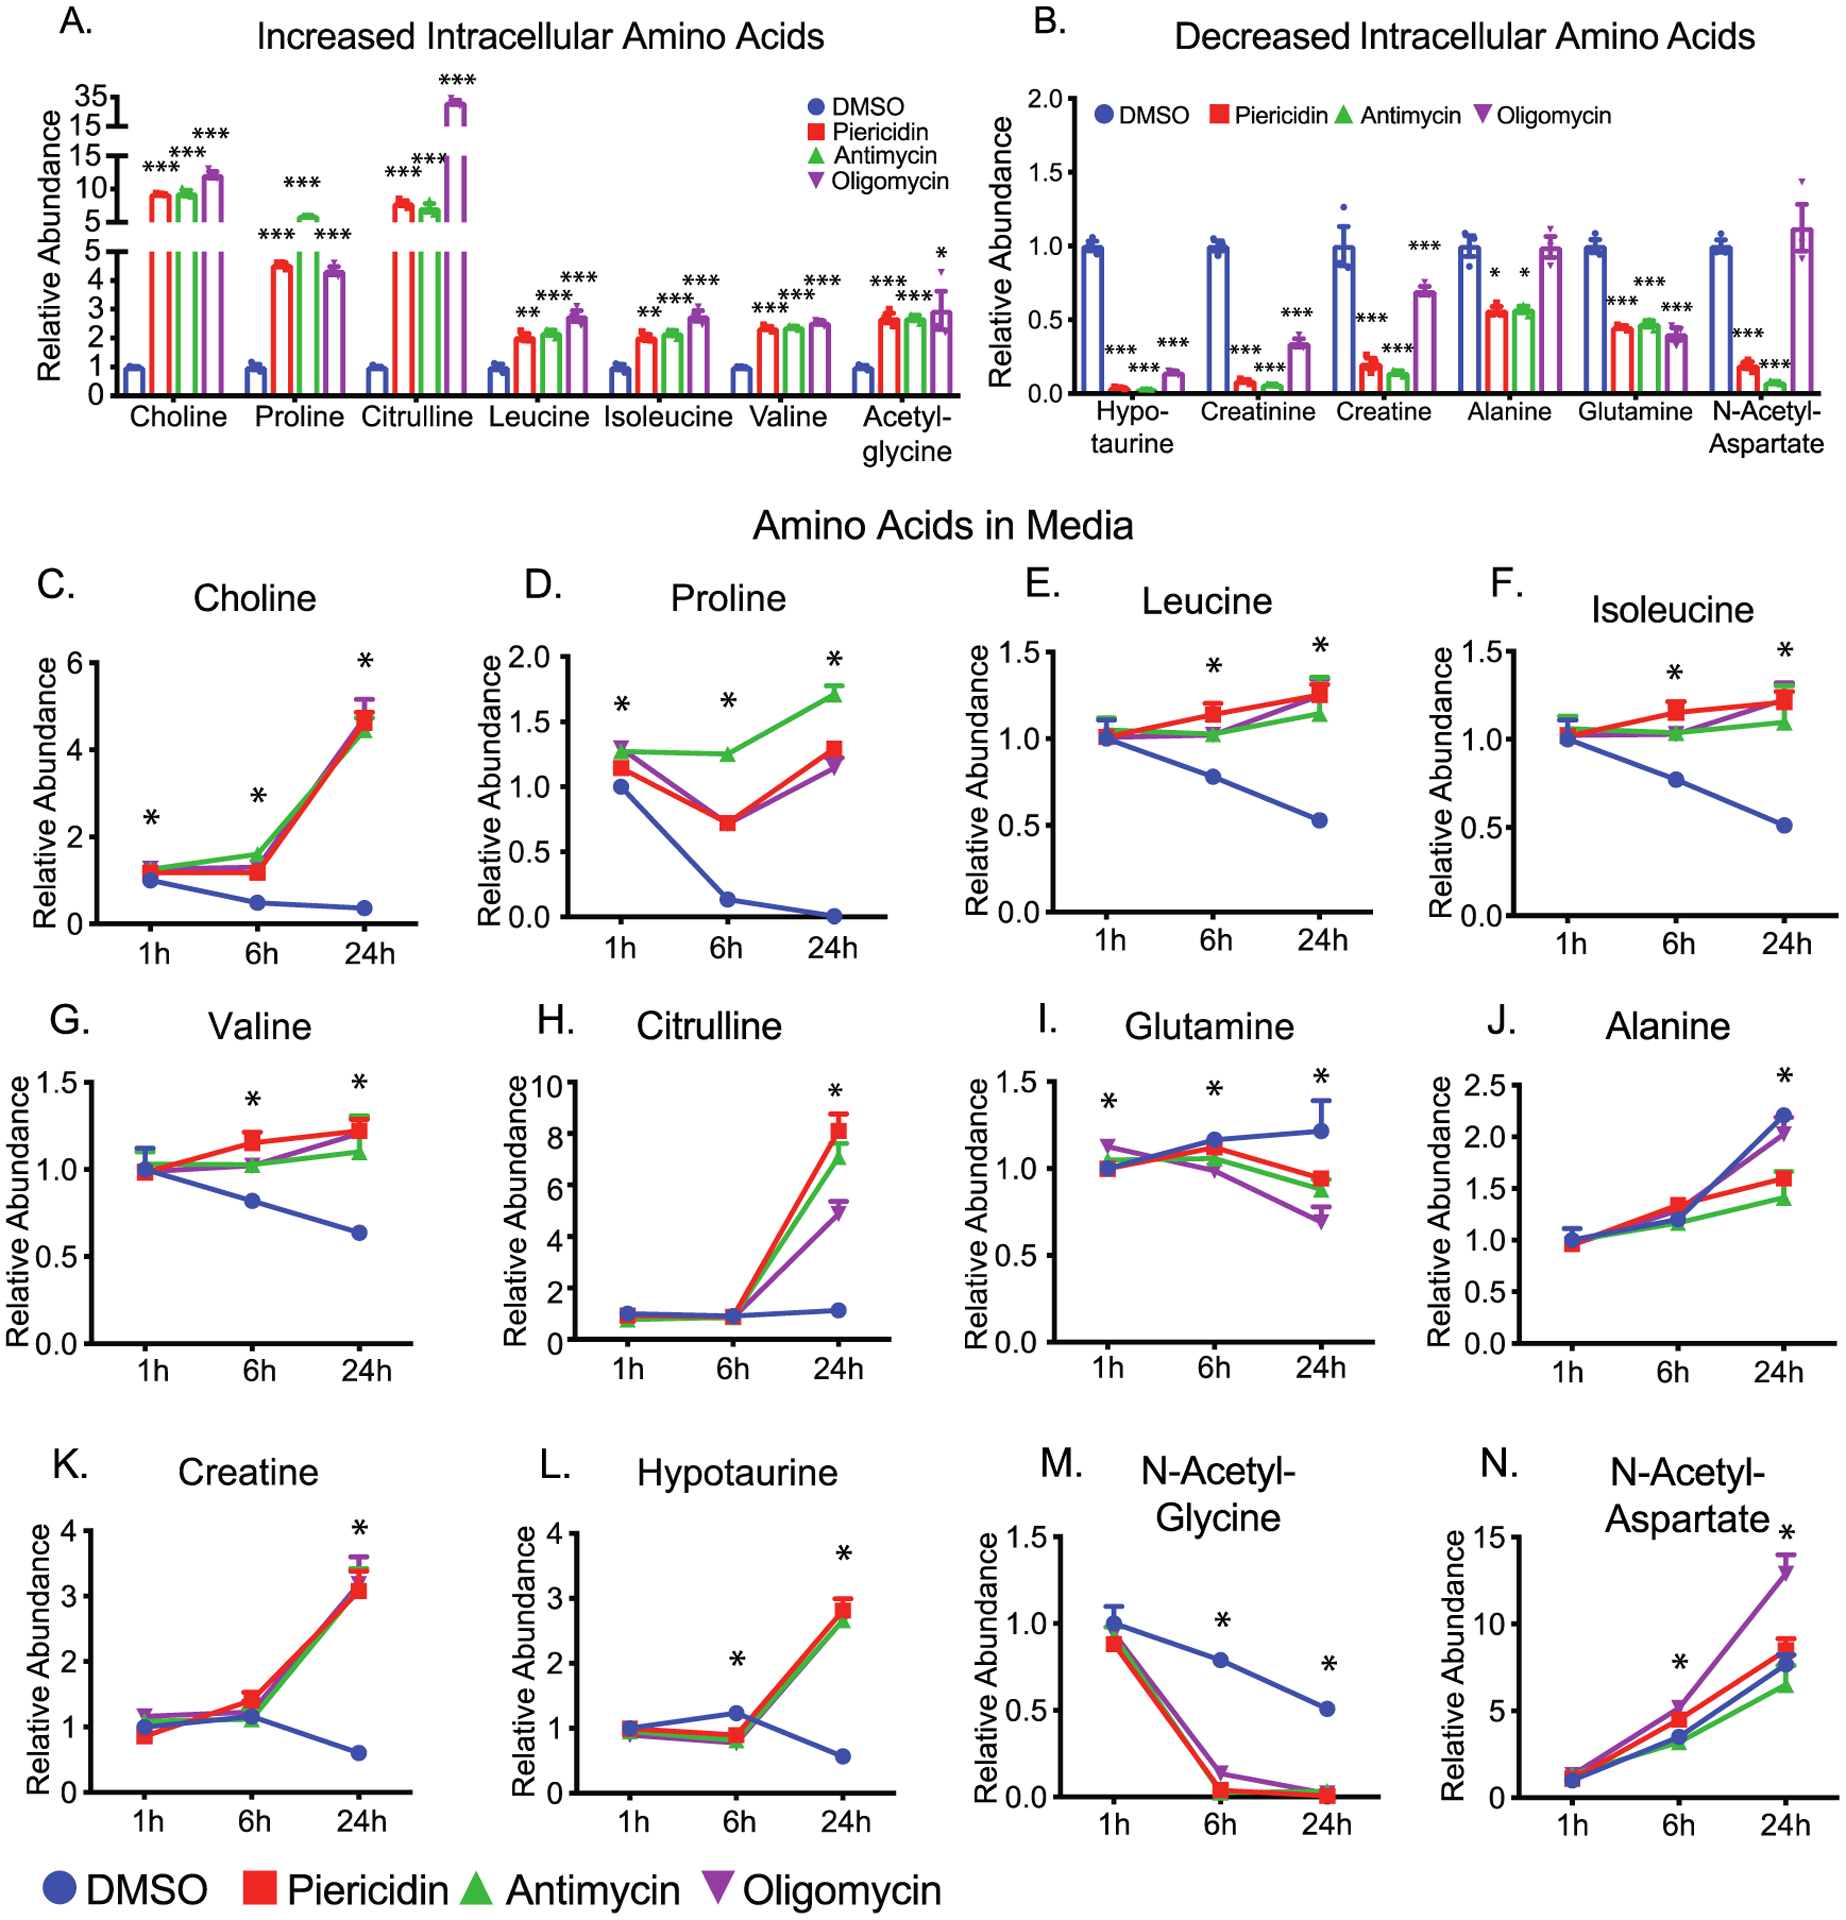
Inhibition of mitochondrial metabolism impairs amino acid metabolism and the urea cycle. (A and B) The relative abundance of significantly increased or decreased intracellular amino acids. (C–N) The relative abundance of amino acids in the media at different time points. N = 3. *P < 0.05, **P < 0.01, ***P < 0.001 vs the groups treated with DMSO. Gln, glutamine.