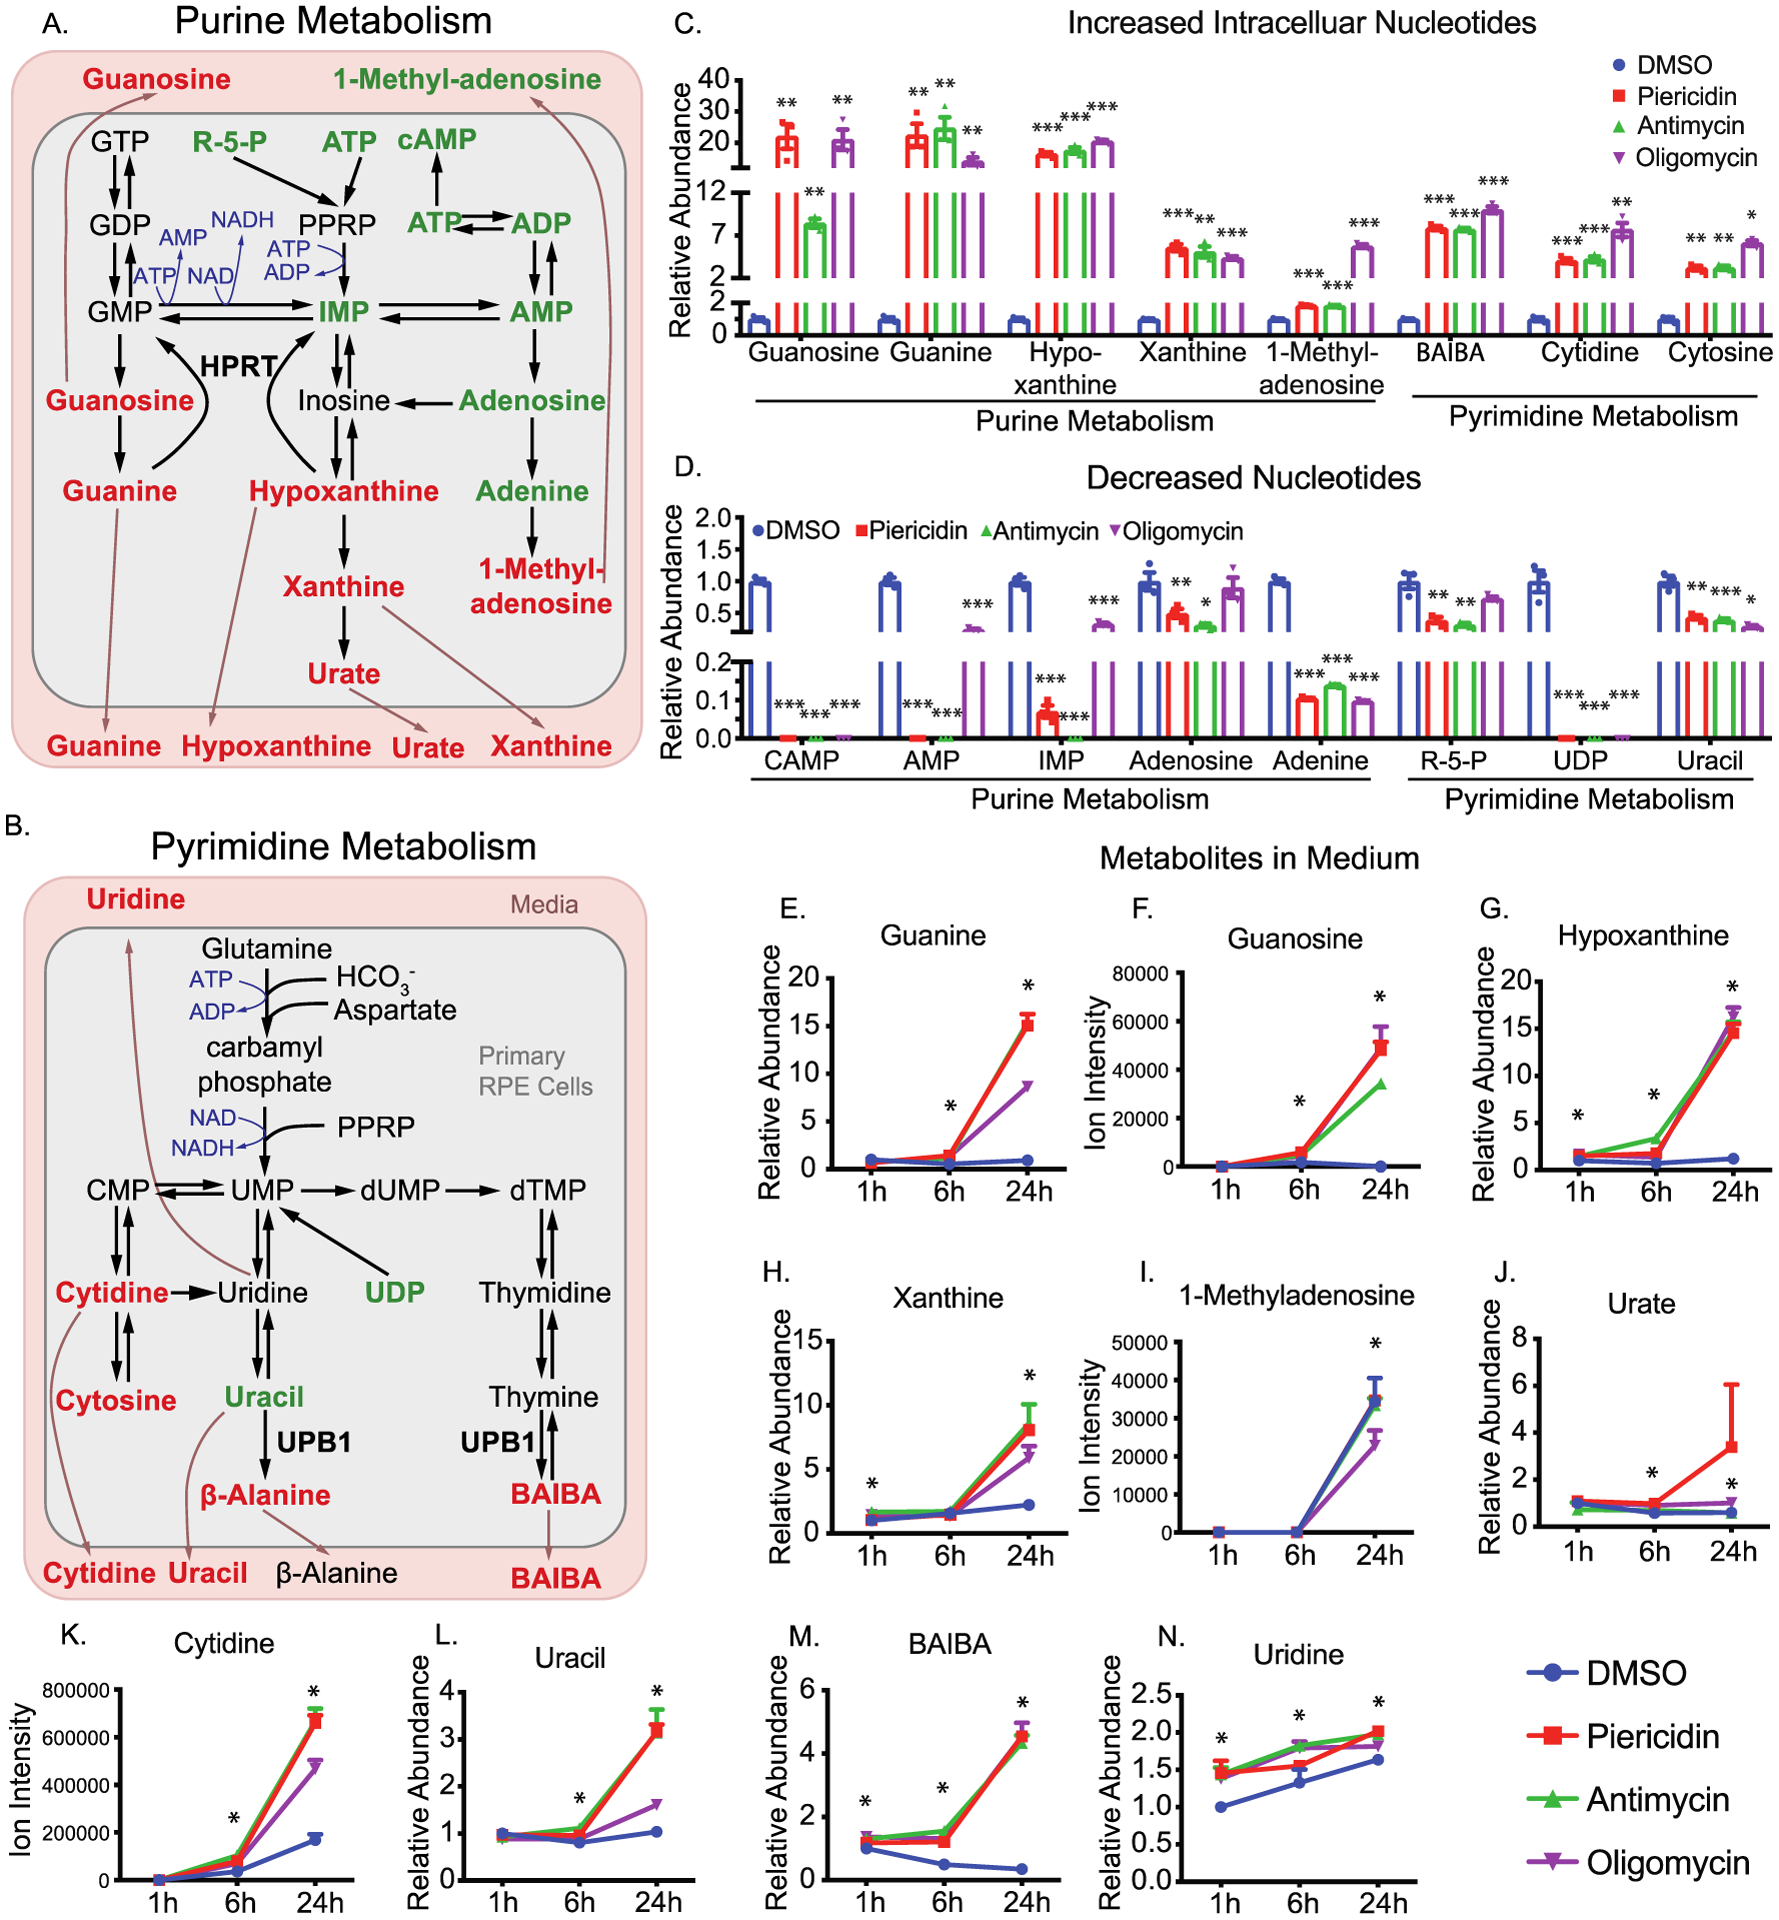
Figure 7.

Inhibition of mitochondrial metabolism impairs nucleotide metabolism. (A and B) Schematics for purine and pyrimidine metabolism. The metabolites are colored to represent relative abundance by the inhibition of mitochondrial metabolism (red for the increase, green for decrease, and black for no change or not detected). (C–D) The relative abundance of significantly changed nucleotides by the inhibition of mitochondrial metabolism. (E–M) The relative abundance of significantly changed medium metabolites in nucleotide metabolism. N = 3. *P < 0.05, **P < 0.01, *P < 0.001 vs the groups treated with DMSO.
