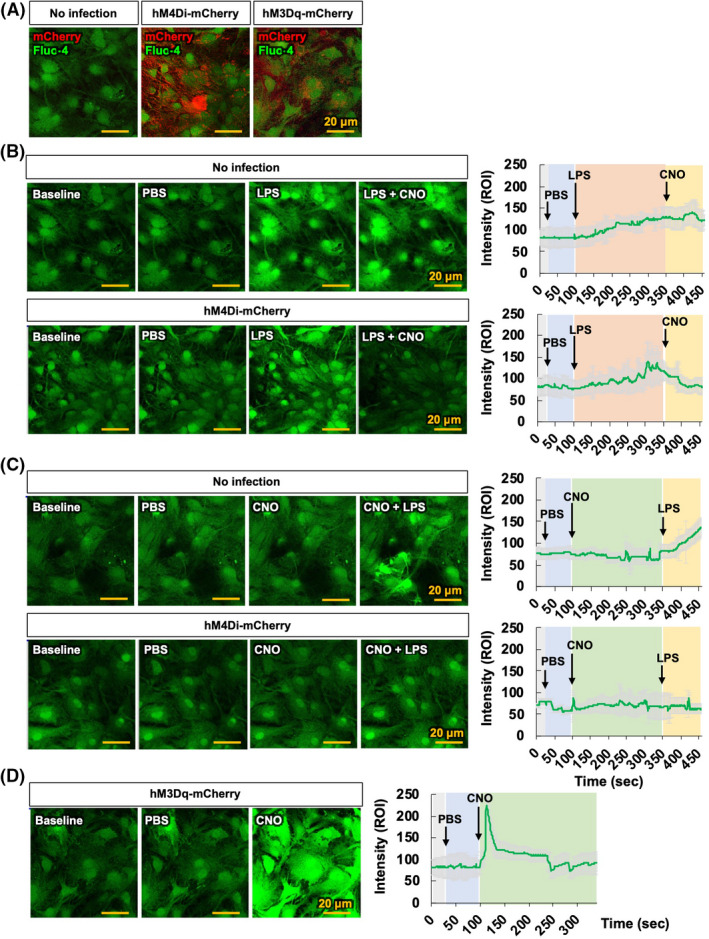
FIGURE 5.

Gi signaling activation in astrocytes inhibits LPS‐induced intracellular Ca2+ levels. (A) Representative images showing co‐localization of Fluo‐4‐AM (green) and mCherry (red) in negative controls, hM4Di‐mCherry‐, and hM3Dq‐mCherry‐infected primary astrocyte cultures. (B, C) Representative images showing Ca2+ transients after treatment with CNO (10 μM) in negative controls and hM4Di‐expressing primary astrocytes loaded with Fluo‐4‐AM. Astrocytes were treated with PBS at 20 s, LPS (100 ng/ml) at 100 s, and CNO at 350 s (B); or treated with PBS at 20 s, CNO at 100 s, and LPS (100 ng/ml) at 350 s (C). Representative traces show the change of intracellular Ca2+ in astrocytes as induced by LPS in the absence or presence of CNO. (D) hM3Dq‐expressing primary astrocytes loaded with Fluo‐4‐AM exhibited Ca2+ transients after treatment with CNO. Astrocytes were treated with PBS at 20 s and CNO at 100 s. Representative traces show the change of intracellular Ca2+ in astrocytes induced by CNO. Arrows indicate the treatment time for PBS, LPS, and CNO in the traces. Results are expressed as means ± SEM (n = 6). Scale bar, 20 μm. eYFP, AAV5‐hGFAP‐eYFP; hM3Dq‐mCherry, AAV5‐hM3Dq‐mCherry; hM4Di‐mCherry, AAV5‐hM4Di‐mCherry
