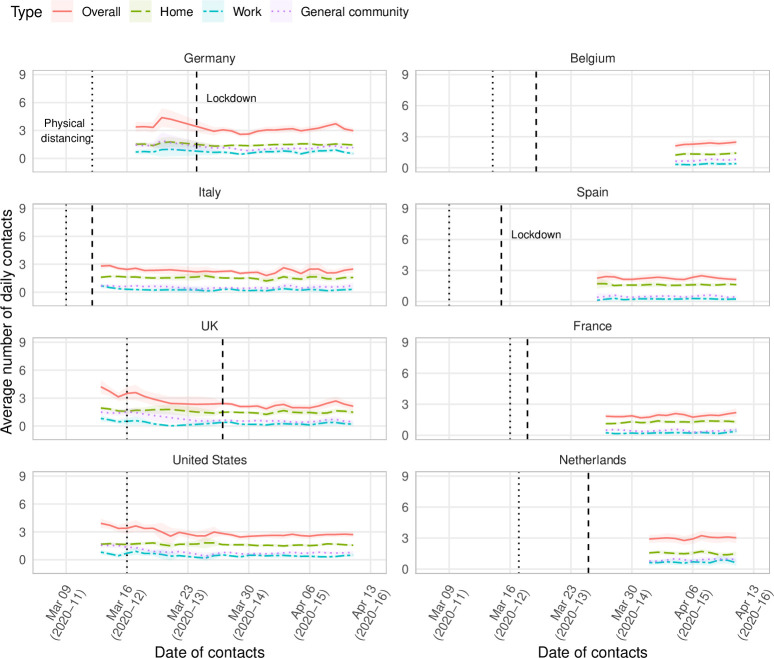
Figure 1.
Mean overall number of daily social contacts (with 95% CI) smoothed by a simple 2-day moving average, by country and study day, March–April 2020. The dotted line corresponds to the date in which the physical distancing guidelines were introduced at the national level; the dashed line corresponds to the date in which the lockdown, regardless of being full or partial, was ordered.

