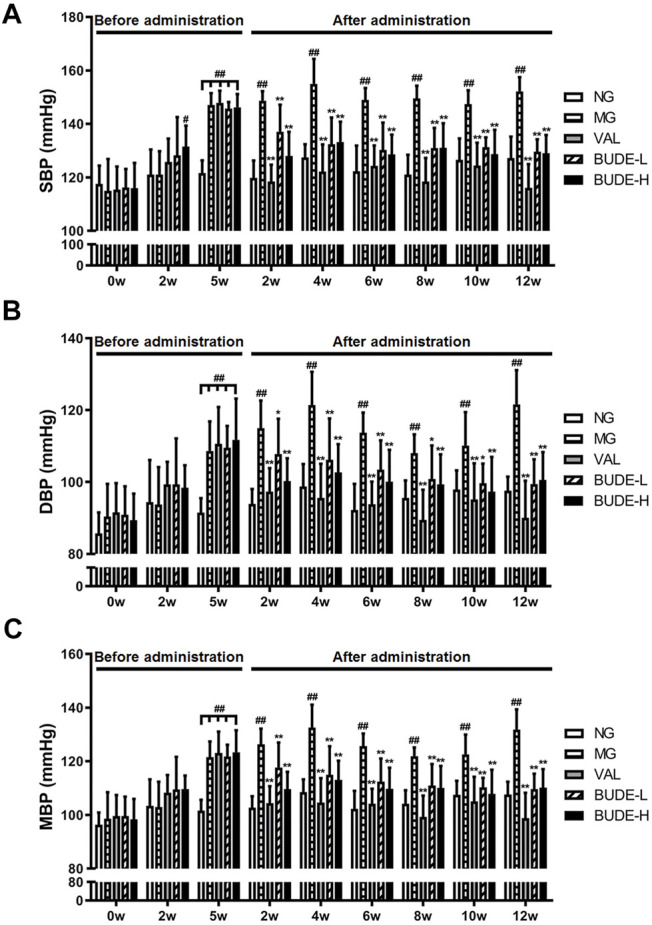
FIGURE 2.

Effect of BUDE on the blood pressure of the model rats. (A) Changes in the systolic blood pressure (SBP). (B) Changes in the diastolic blood pressure (DBP). (C) Changes in the mean blood pressure (MBP). Compared with the normal control group # p < 0.05, ## p < 0.01; compared with the model control group * p < 0.05, ** p < 0.01, n = 8–10. NG: normal control group; MG: ACHSFDs model group; VAL: valsartan group; BUDE-L: BUDE low-dose group; BUDE-H: BUDE high-dose group.
