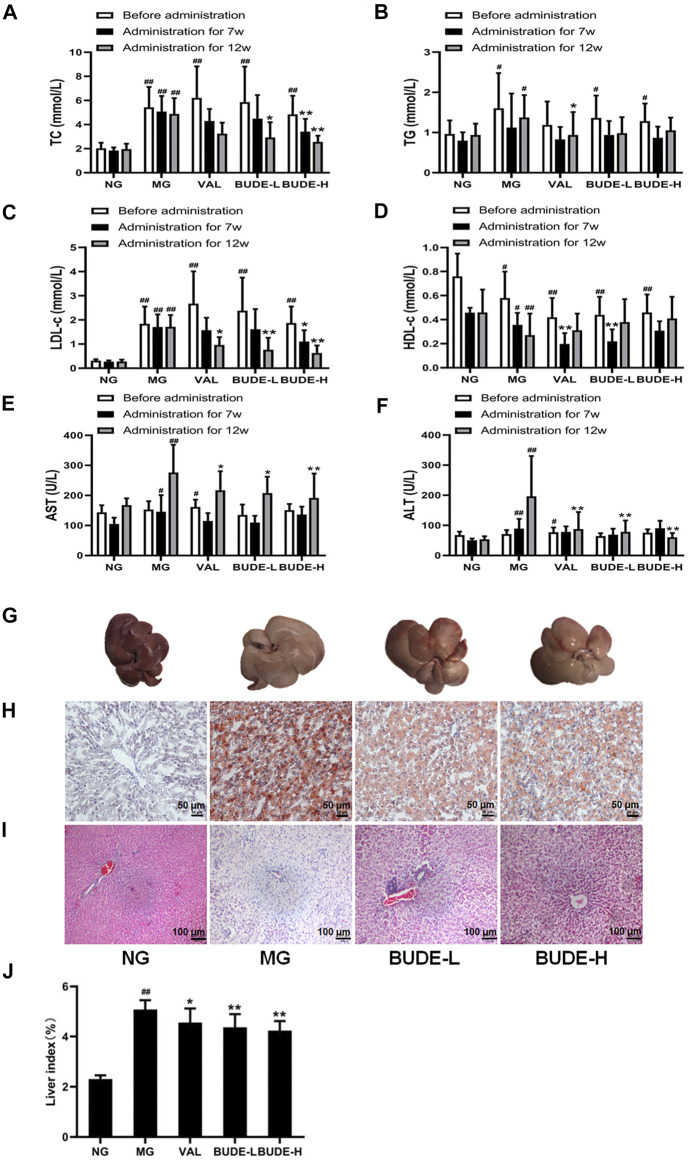
FIGURE 3.
Changes of blood lipid, serum transaminase, and liver pathological. (A) Changes in the serum total cholesterol (TC). (B) Changes in the serum triglyceride (TG). (C) Changes in the serum low density lipoprotein cholesterol (LDL-c). (D) Changes in the serum high density lipoprotein cholesterol (HDL-c). (E) Changes in the serum aspartate aminotransferase (AST). (F) Changes in the serum alanine aminotransferase (ALT). (G) Liver gross morphology. (H) Oil red O staining of liver under magnification ×100 (I) Representative graph (×100) of hematoxylin and eosin staining of liver (J) Liver index. Compared with the normal control group # p < 0.05, ## p < 0.01; compared with the model control group * p < 0.05, ** p < 0.01, n = 7–10.

