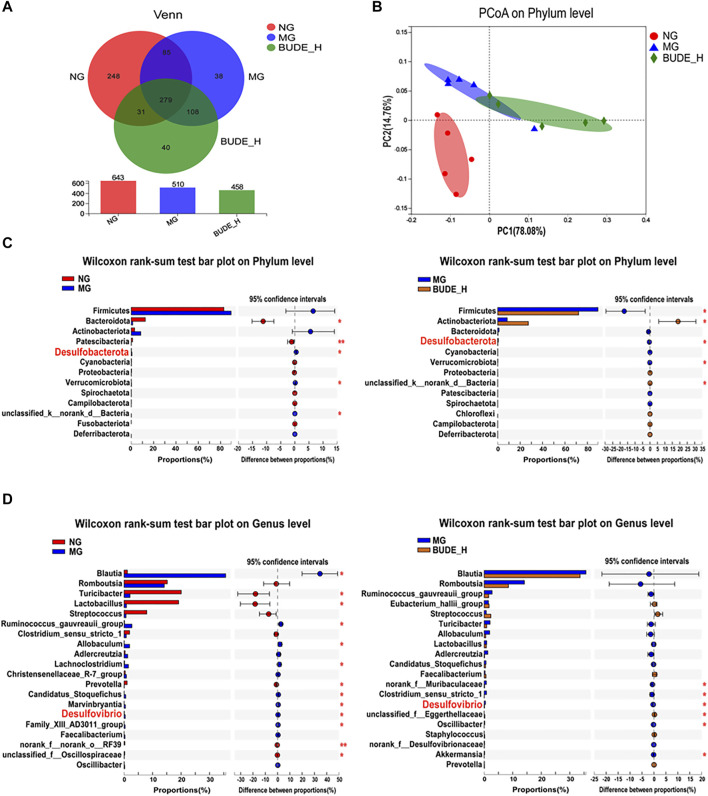
FIGURE 6.
Effect of BUDE on the intestinal flora. (A) Venn diagram. (B) PCoA analysis of phylum level in groups. (C) Analysis of the difference microbiota abundance between the NG, MG and BUDE-H at the phylum level. (D) Analysis of the difference of the top 50 of intestinal flora abundance between the NG, MG and BUDE-H groups at the genus level. * p < 0.05, ** p < 0.01, n = 5.

