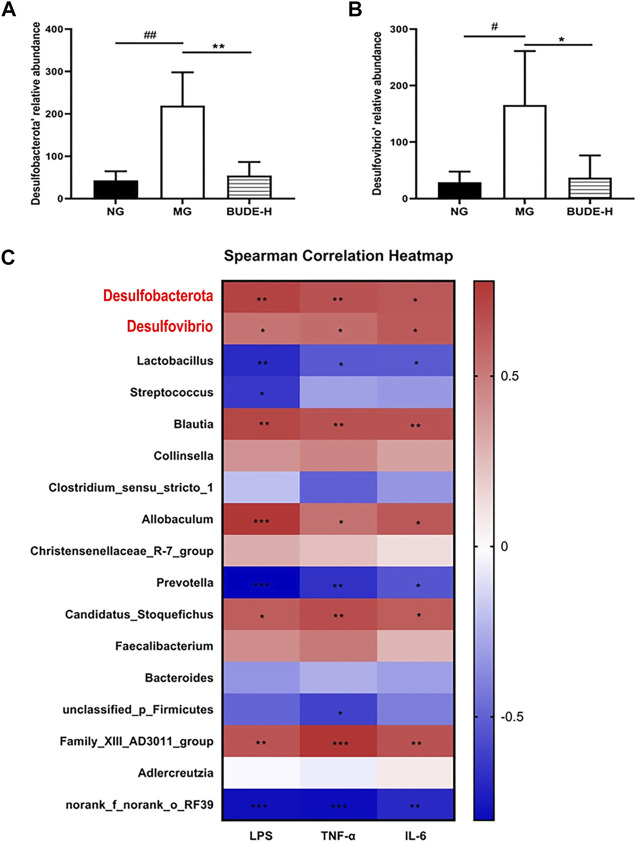
FIGURE 7.
Correlation analysis between LPS and intestinal flora. (A) Relative abundance of Desulfobacterota. (B) Relative abundance of Desulfovibrio. (C) The spearman correlation between LPS, TNF-α, IL-6 and intestinal flora. Compared with the normal control group # p < 0.05, ## p < 0.01; compared with the model control group * p < 0.05, ** p < 0.01, n = 5.

