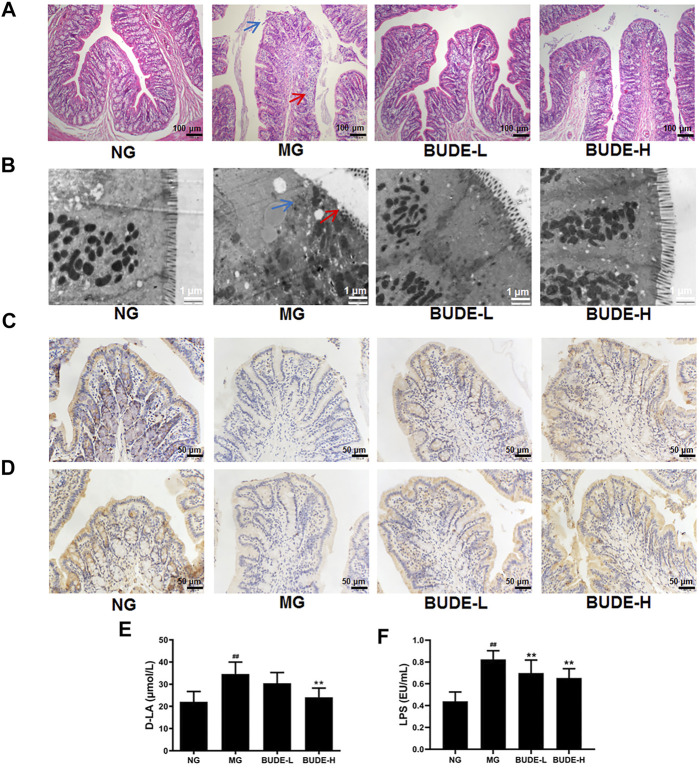
FIGURE 8.
Effect of BUDE on intestinal barrier. (A) Representative graph (×200) of hematoxylin and eosin staining of the colon: shedding of colonic villi (blue arrow) and a small amount of inflammatory cell infiltration (red arrow) (B) Colon ultrastructure by transmission electron microscopy (TEM) observed at magnification × 20000: Villi loss (red arrow) and tight junction protein damage (blue arrow). (C) Representative figures of immunohistochemical staining of claudin-1 in the colon (×200). (D) Representative charts of immunohistochemical staining of occludin in the colon (×200). (E) Changes in the plasma d-lactic acid (D-LA). (F) Changes in the plasma lipopolysaccharide (LPS). Compared with the normal control group # p < 0.05, ## p < 0.01; compared with the model control group * p < 0.05, ** p < 0.01, n = 3, 9.

