Figure 7.
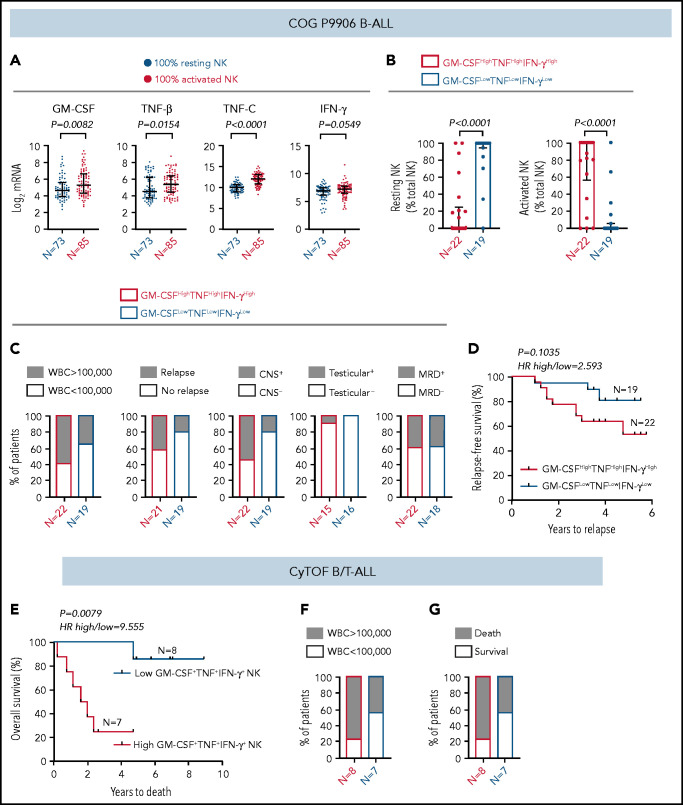
High frequency of cytokine-producing NK cells predicts increased severity and poor prognosis for ALL. (A) Comparison of transcript levels of GM-CSF (CSF2), TNF-β (LTA), TNF-C (LTB), and IFN-γ between COG P9906 B-ALL patients (GSE11877), assigned to 2 groups using CIBERSORT, as 100% resting NK cells (n = 73) or 100% activated NK cells (n = 85). Data are shown as median ± interquartile range. (B) CIBERSORT was used to compare the estimated relative proportions of resting and activated NK cells within total NK cells in GM-CSFHighTNFHighIFN-γHigh (n = 22) and GM-CSFLowTNFLowIFN-γLow (n = 19) B-ALL patients from COG P9906 (GSE11877). Patients were assigned to high and low groups based on the median expression of each transcript. The LM22 signature matrix (GSE22886), which contains the transcriptomic profile of resting NK cells and cytokine (IL-2, IL-15)–activated NK cells, was used to deconvolute the bulk transcriptomic profiles of COG P9906 B-ALL patients. Data are median ± interquartile range. (C) Stacked bar charts comparing the proportions of GM-CSFHighTNFHighIFN-γHigh and GM-CSFLowTNFLowIFN-γLow COG P9906 B-ALL patients (GSE11877) with WBC count >100 000, relapse, CNS involvement (CNS+), testicular involvement in male patients (Testicular+), and positive MRD on day 29 (MRD+). (D) Comparison of RFS probabilities of GM-CSFHighTNFHighIFN-γHigh and GM-CSFLowTNFLowIFN-γLow COG P9906 patients with B-ALL (GSE11877). (E) Comparison of overall survival probabilities of CyTOF patients with B/T-ALL (n = 20) divided into 2 groups based on the median frequencies of GM-CSF+, TNF+, and IFN-γ+ NK cells as High GM-CSF+TNF+IFN-γ+ NK cells and Low GM-CSF+TNF+IFN-γ+ NK cells. Stacked bar charts comparing the proportions of High GM-CSF+TNF+IFN-γ+ NK cells and Low GM-CSF+TNF+IFN-γ+NK cells using CyTOF in B/T-ALL patients based on WBC count (F) and survival (G). Survival curves were produced using the Kaplan-Meier method. For survival curves, exact P values were calculated using the log-rank test. For all other analyses, the exact P values were calculated using the Mann-Whitney U test, HR, hazard ratio.

