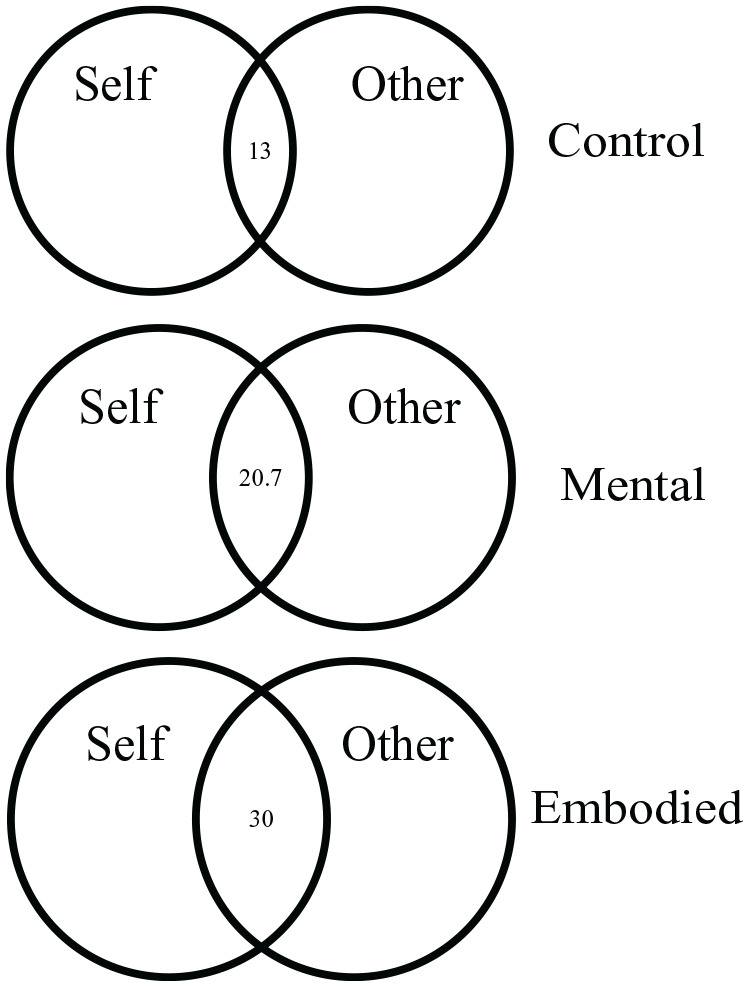
Figure 6.

Interpolation of the inclusion of the other in the self scale by experimental group.
Note. Circles and numbers represent the average percentage overlap for each group, using linear interpolation from the original Inclusion of the Other in the Self (IOS) scale. Self–other merging was highest in the Embodied Perspective-Taking group, followed by the Mental Perspective-Taking group, followed by the control group.
