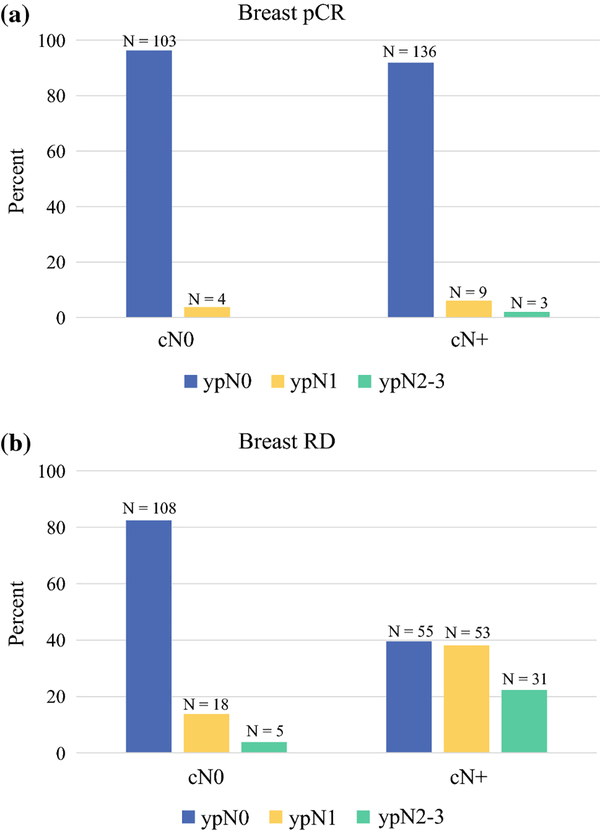
Figure 1(a, b).
Figure 1 presents ypN0, ypN1, and ypN2–3 disease rates for patients who presented with cN0 and cN+ disease and experienced a) breast pCR (N = 255) or b) breast RD (N = 270). Patients with missing clinic T category were excluded from this analysis.

