
Fig. 4.
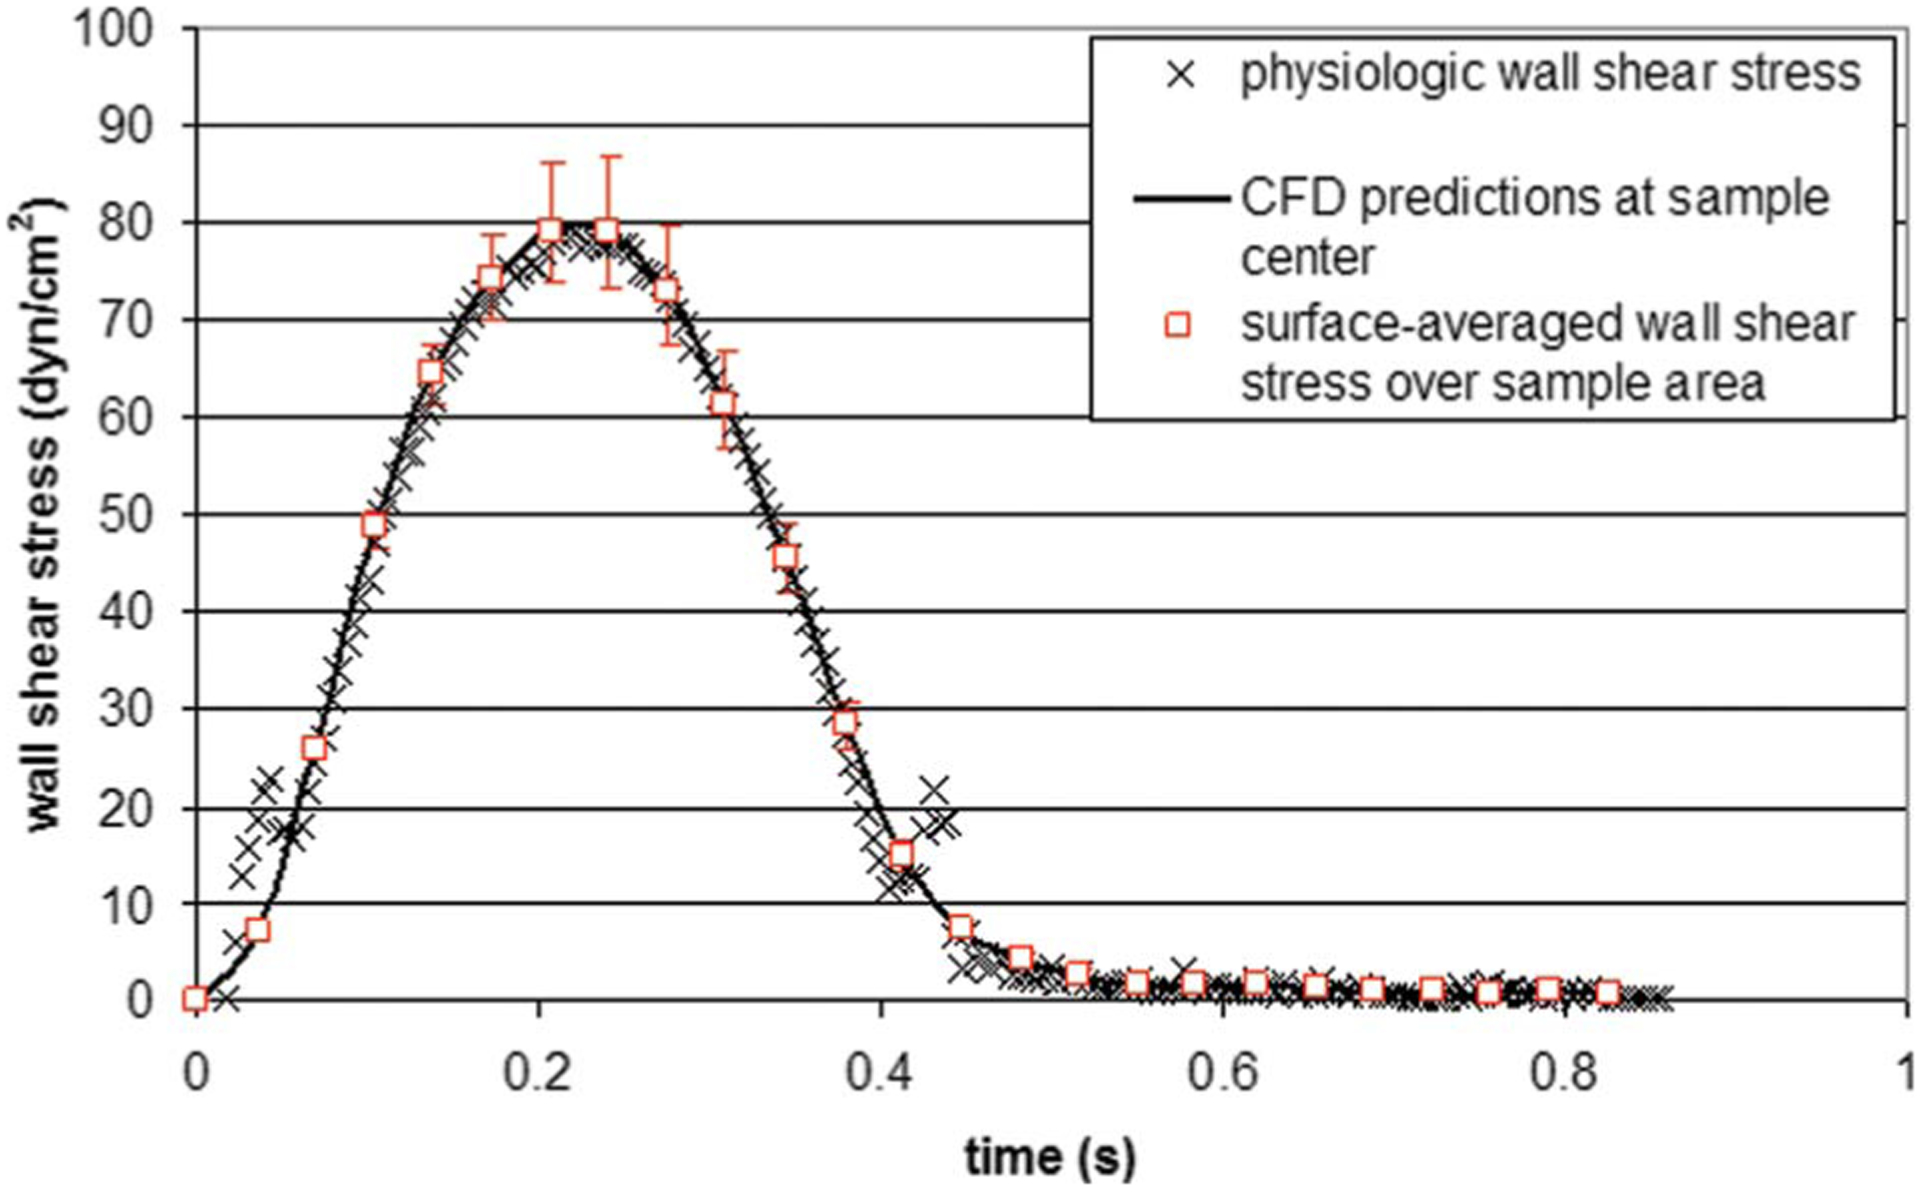
Comparison between the physiologic wall-shear stress experienced by the ventricular surface of an aortic valve leaflet, the wall-shear stress predicted by CFD at the center of the area covered by a tissue sample, and the surface-averaged wall-shear stress predicted by CFD over the sample area. The red markers indicate the maximum and minimum wall-shear stress values computed over the sample area.