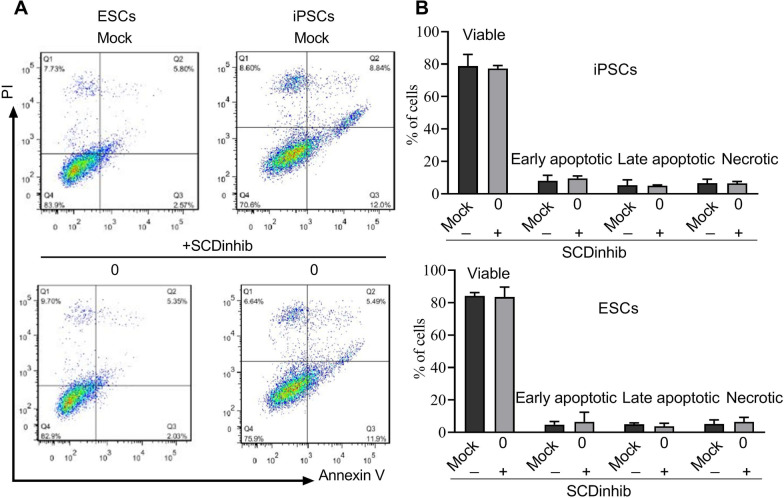
Fig. 1.
Flow cytometric analysis of pluripotent stem cells after treatment with the SCD1 inhibitor. A Representative flow cytometry dot plots showing four-cell fractions: viable cells (annexin V−/PI−), early apoptotic cells (annexin V+/PI−), late apoptotic cells (annexin V+/PI+), and necrotic cells (annexin V−/PI+). The induced pluripotent stem cells (iPSCs) and embryonic stem cells (ESCs) were mock-treated with DMSO (< 0.05%, above) or treated with 25 nmol/L of SCD1 inhibitor (SCDinhib) on Day 0 of differentiation (below) for 4 days. Cells were then harvested and evaluated for apoptosis and necrosis. B Quantification of cells in different groups

