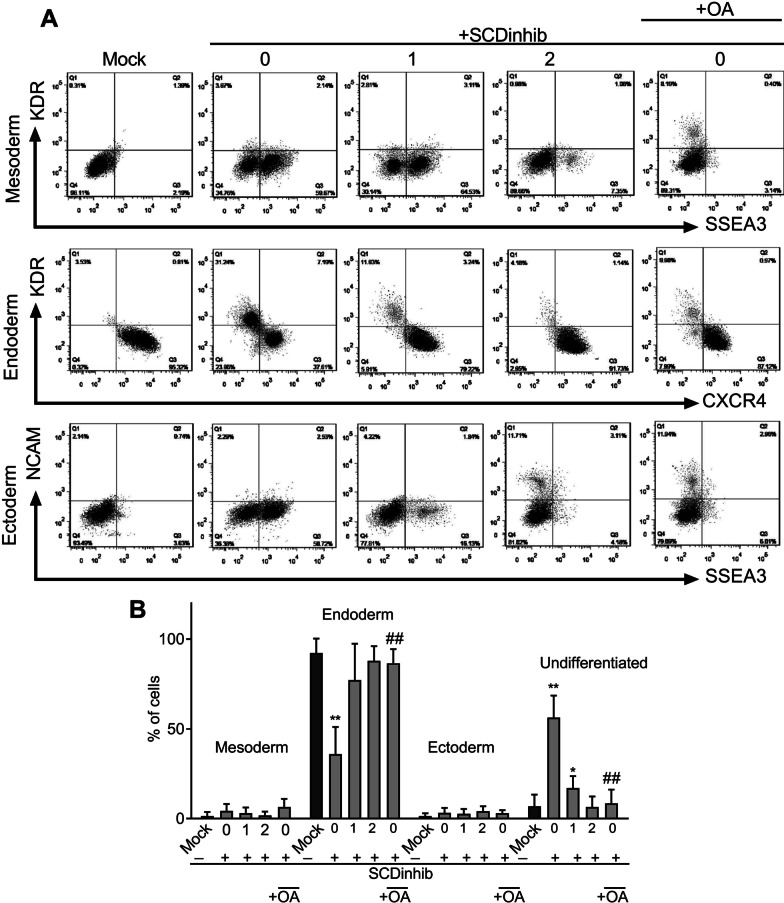
Fig. 5.
The germ layer markers following inhibition of SCD1 during endodermal differentiation of the induced pluripotent stem cells (iPSCs). Cells were induced to differentiate while treated with SCD1 inhibitor (SCDinhib) alone at Days 0, 1, or 2 (0, 1, and 2) of differentiation or in combination with oleic acid (OA) at Day 0. The cells were harvested on Day 4 and analyzed using flow cytometry. A Representative flow cytometry dot plots of the dual staining pattern of mesoderm (KDR+, SSEA3−), endoderm (CXCR4+, KDR−), ectoderm (SSEA3+, NCAM+), and undifferentiated (SSEA3+, NCAM−) cells. B Quantification of flow cytometry results in different groups. *p < 0.05, **p < 0.01 versus mock, #p < 0.05, # #p < 0.01 versus the same day in SCDinhib

