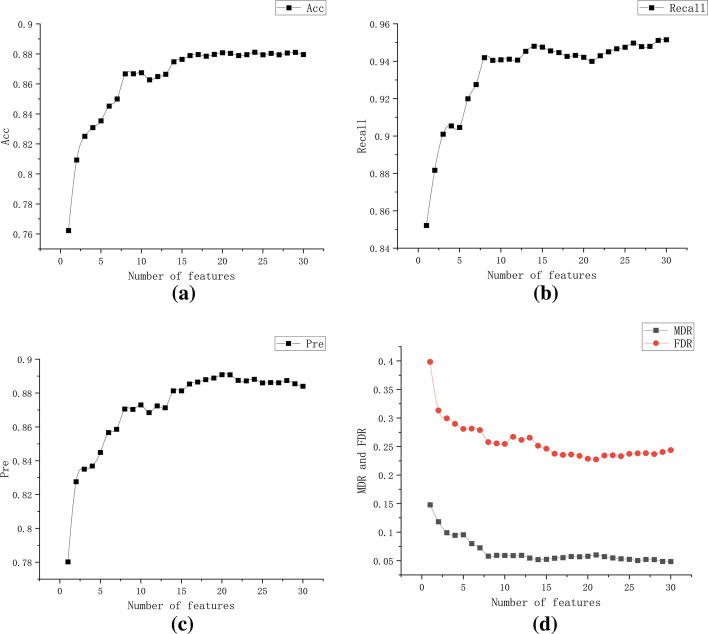
Fig. 4.
Summary results for each evaluation indicator under different number of features. a The horizontal axis indicates the number of features, and the vertical axis indicates the classification accuracy rate. b The horizontal axis indicates the number of features, and the vertical axis indicates the recall rate. c The horizontal axis indicates the number of features, and the vertical axis indicates the precision rate. d The horizontal axis represents the number of features, and the vertical axis represents false discovery rate (FDR) and miss discovery rate (MDR) for different number of features

