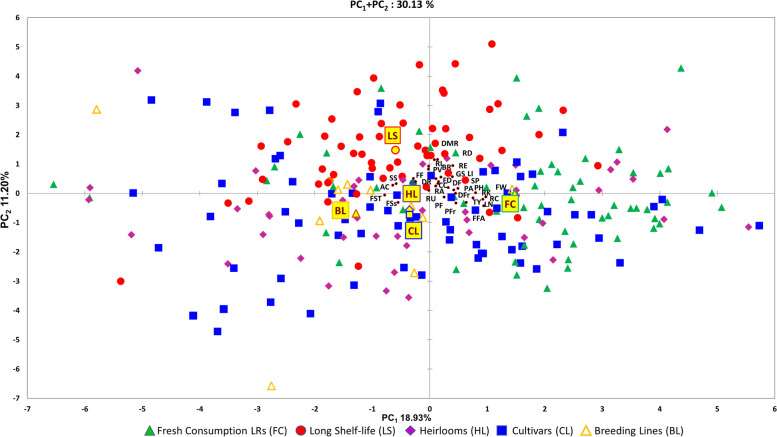
Fig. 5.
Phenotypic variability of the 244 cultivated tomato genotypes. Scatter plot of the first (PC1) and second (PC2) principal components showing the variation for 31 pseudo-qualitative and quantitative morphological, agronomic and root traits scored in two environments. Based on cultivar groups, accessions are represented by different coloured symbols indicated in the legend. The first and second component centroids for each cultivar groups are indicated by filled yellow symbols with shape and edge colour according to cultivar groups (see legend). The direction from the centre of the biplot indicate how each trait contributes to the first two components. Trait acronyms are listed in Table 1

