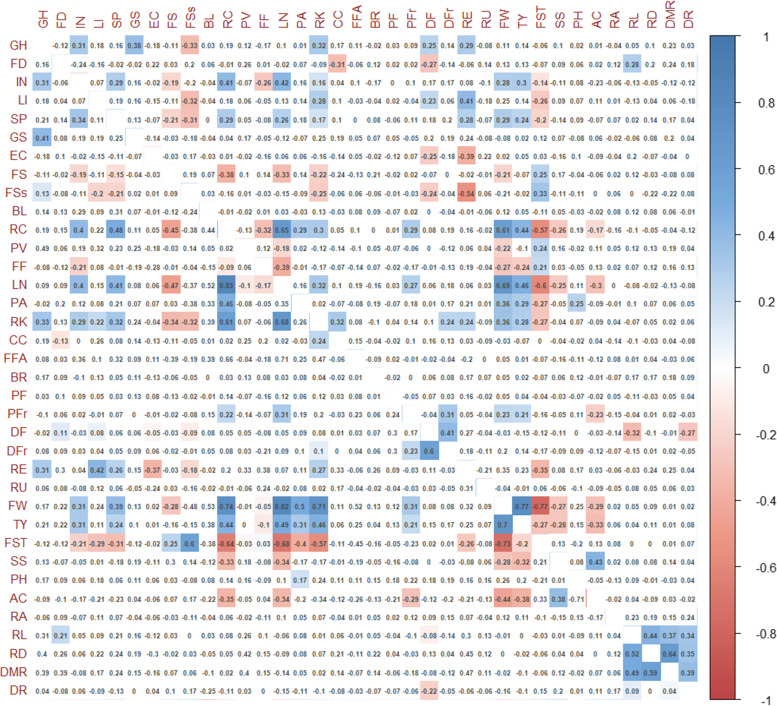
Fig. 6.
Spearman’s rank correlation coefficients between pairs of phenotypes. Correlation coefficients are indicated in each cell. Coloured correlations are those with P value < 0.05 after Bonferroni correction. Colour intensity is directly proportional to the coefficients. On the right side of the correlogram, the legend colour shows the correlation coefficients and the corresponding colours. Correlogram for traits scored in Spain is placed below the diagonal, the correlogram for traits scored in Italy is placed upside the diagonal. Trait acronyms are listed in Table 1

