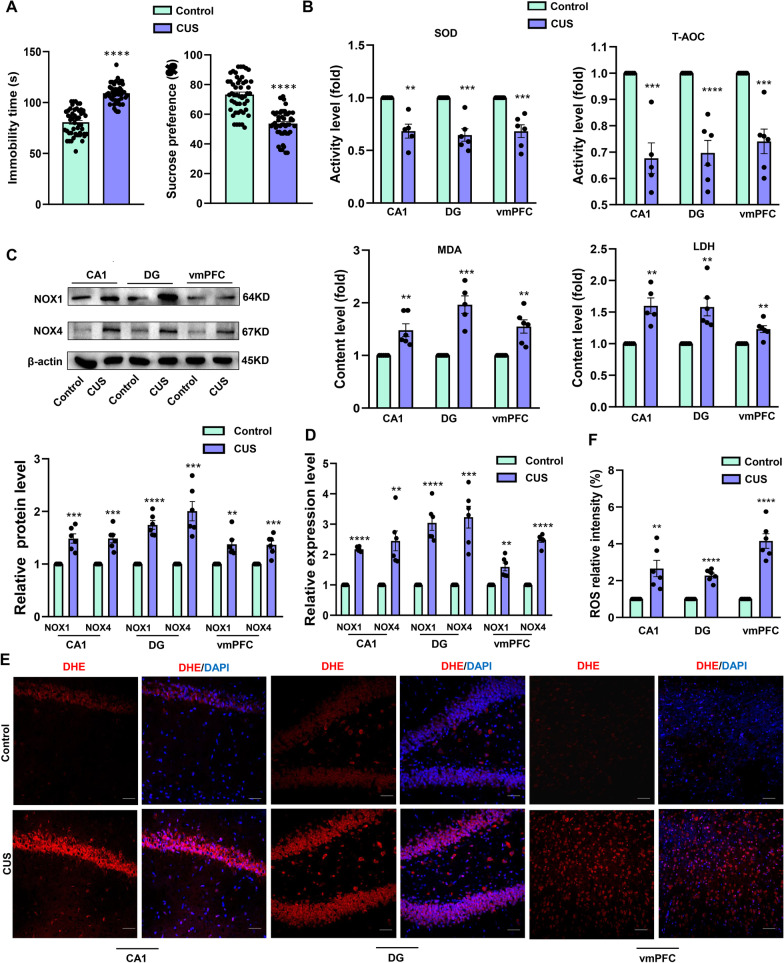
Fig. 1.
Oxidative damage as observed in the hippocampal DG region and vmPFC of CUS rats. A Behavioral responses of FST and SPT in control rats and CUS model rats (N = 50 per group). B Activity of antioxidant enzymes SOD and T-AOC. Contents of MDA and LDH were analyzed and levels were normalized to total protein content (N = 5–6 per group). C Representative western blot images showing relative protein levels NOX1 and NOX4 (N = 6 per group). D Q-PCR analysis of NOX1 and NOX4 mRNA levels of each group. Band intensities were normalized to GAPDH (N = 6 per group). E Representative images of DHE staining (red) within the DG area from each group of rats following ROS analysis (N = 6 per group). Nuclei (blue) are stained with DAPI. Scale bar is 50 μm. F ROS relative intensity analysis after DHE staining in each group *P < 0.05, **P < 0.01, ***P < 0.001, ****P < 0.0001, vs Control group. Data are presented as means ± SEMs. Student t-tests were employed for comparisons between the two groups

