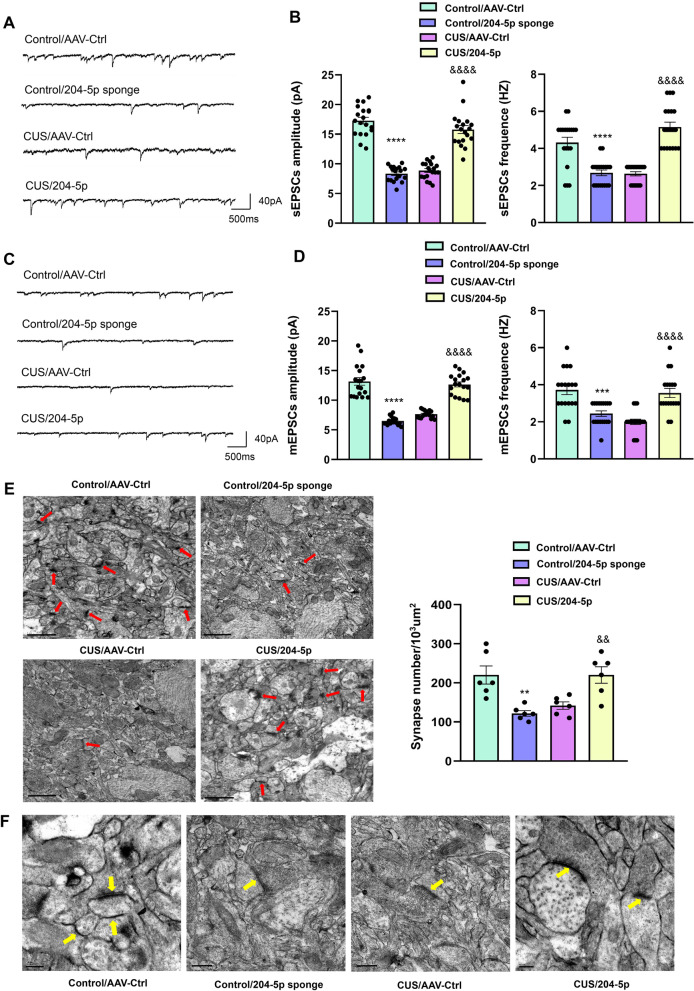
Fig. 7.
MiR-204-5p regulates synaptic plasticity of DG neurons in rats. A Representative traces of sEPSCs in DG neurons of rats infected with the virus. B Cumulative fraction plots of sEPSCs amplitudes and frequencies. C Cumulative fraction plots of mEPSCs amplitudes and frequencies. D Representative traces of mEPSCs in DG neurons of rats infected with the virus. N = 18 neurons from six rats in each group. E Representative electron micrographs and summary of data showing the number of synapsis. Arrows indicate neuronal synapses. Scale bar is 1 μm. (N = 6 per group). F Representative electron micrograph of DG neurons in rats from each group (N = 6 per group). Arrows indicate neuronal synapses. Scale bar is 0.2 μm. **P < 0.01 ***P < 0.001, ****P < 0.0001, control + AAV-control vs control + AAV-miR-204-5p sponge; &&P < 0.01, &&&&P < 0.0001, CUS + AAV-control vs CUS + AAV-miR-204-5p. Data are presented as means ± SEMs. Student t-tests were employed for comparisons between the two groups. Two-way ANOVA was used for multiple comparisons involving > 2 groups

