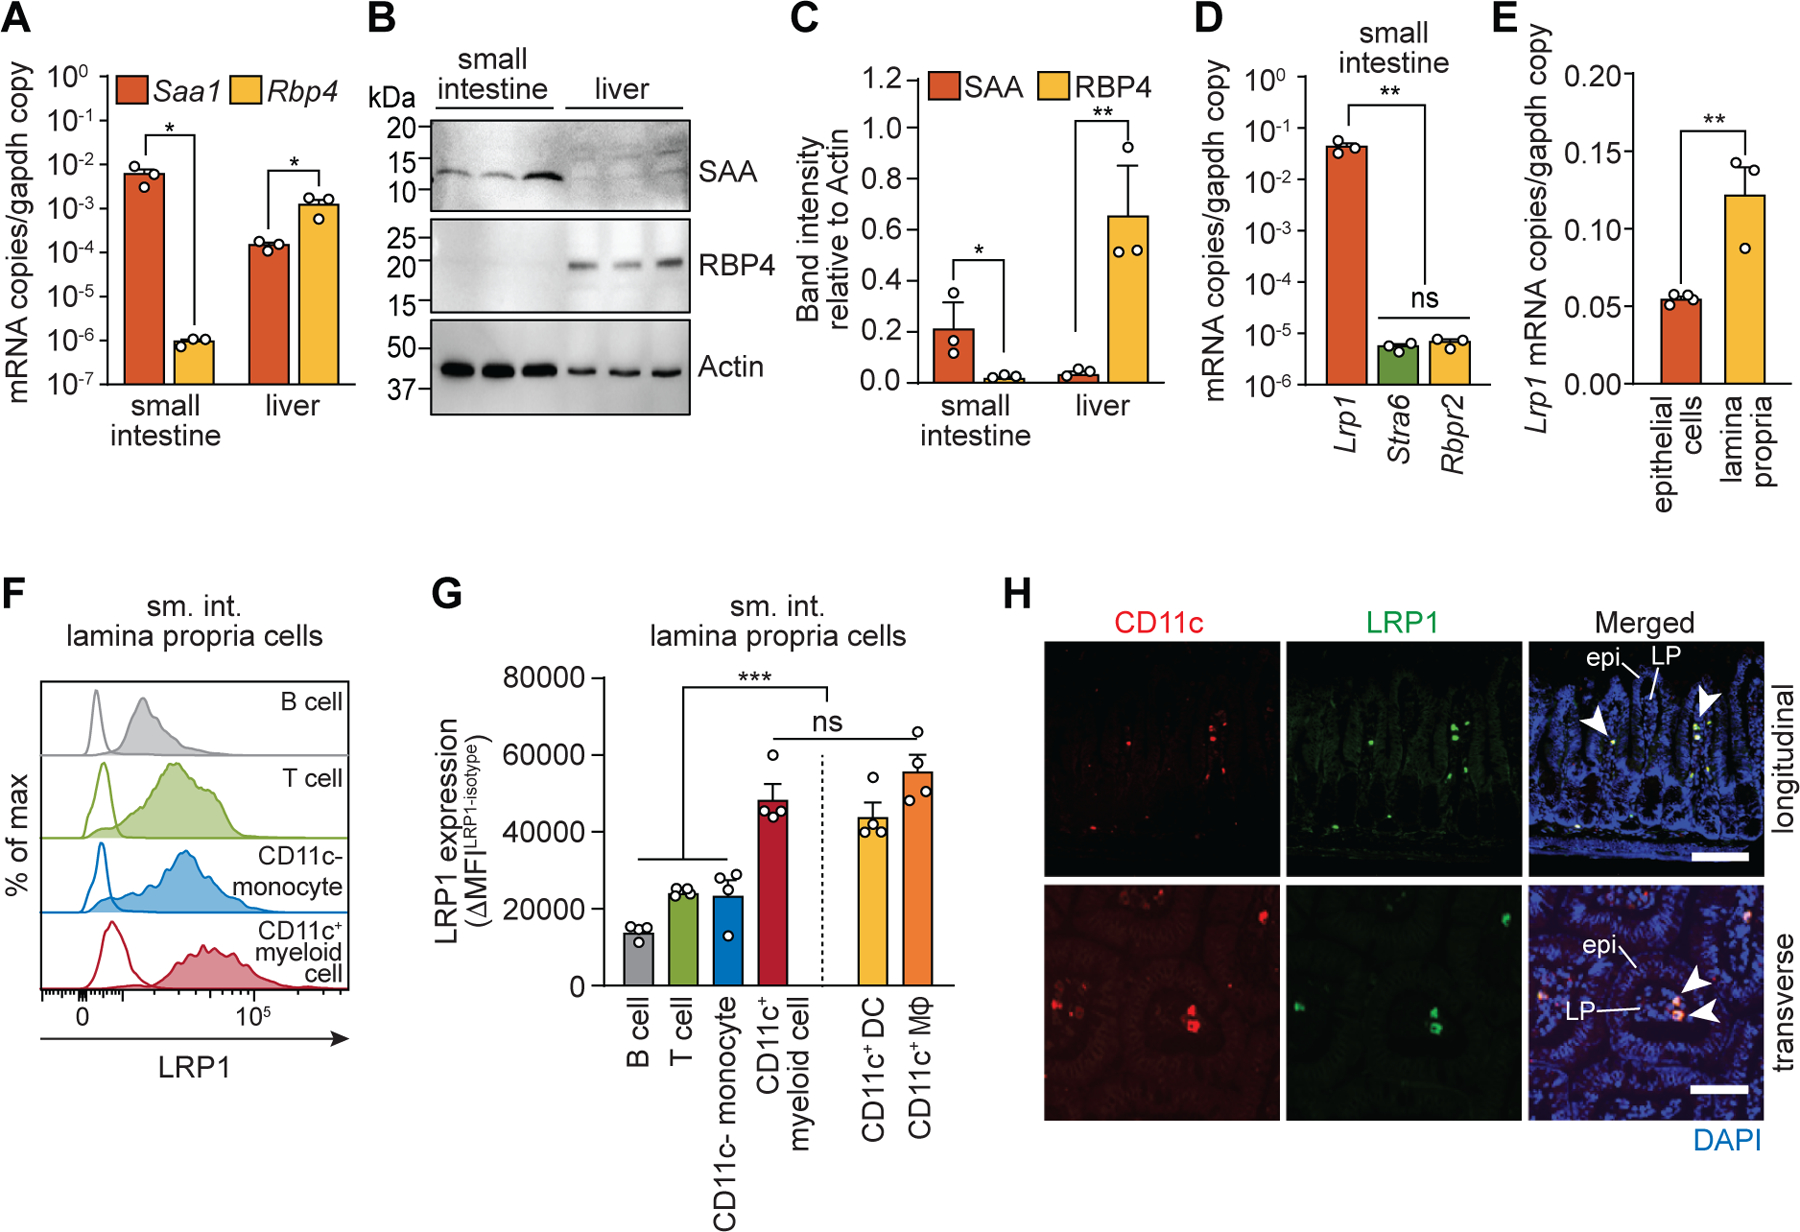
Fig. 3. LRP1 is expressed on intestinal CD11c+ myeloid cells.

(A) qPCR analysis of Saa1 and Rbp4 transcripts in ileum and liver. (B and C) Immunoblotting of SAA, RBP4, and actin (loading control) in mouse ileum and liver. SAA and RPB4 band intensities were measured, normalized to actin, and are shown in relative units in (C). (D) qPCR analysis of Lrp1, Stra6, and Rbpr2 transcripts in mouse ileum. (E) qPCR analysis of Lrp1 transcripts in small intestinal epithelial cells and immune cells isolated from the small intestinal lamina propria. (F and G) Flow cytometry analysis of LRP1 expression on B cells, T cells, monocytes, and CD11c+ myeloid cells. (F) Representative histograms showing LRP1 expression. Empty histograms are from isotype controls. (G) LRP1 expression (ΔMFI) is shown as the difference in MFI between isotype-matched control and anti-LRP1 antibody staining (MFILRP1-MFIisotype). (H) Immunofluorescence detection of CD11c (red), LRP1 (green), and nuclei (blue) in the mouse small intestine. Longitudinal (top) and transverse (bottom) section of villi are shown. Examples of LRP1+ and CD11c+ cells are indicated with arrowheads. Epi, epithelium; LP, lamina propria. Scale bars indicate 100 μm (upper panel) and 50 μm (lower panel), respectively. Detection with isotype control antibody is shown in fig. S5.
sm. int., small intestine; MΦ, macrophage. At least three wild-type C57BL/6 mice were analyzed in each experiment. For qPCR, mRNA copy numbers were calculated from the standard and normalized to Gapdh copy numbers. Means±SEM are plotted. *P<0.05; **P<0.01; ***P<0.001; ns, not significant by Student’s t test.
