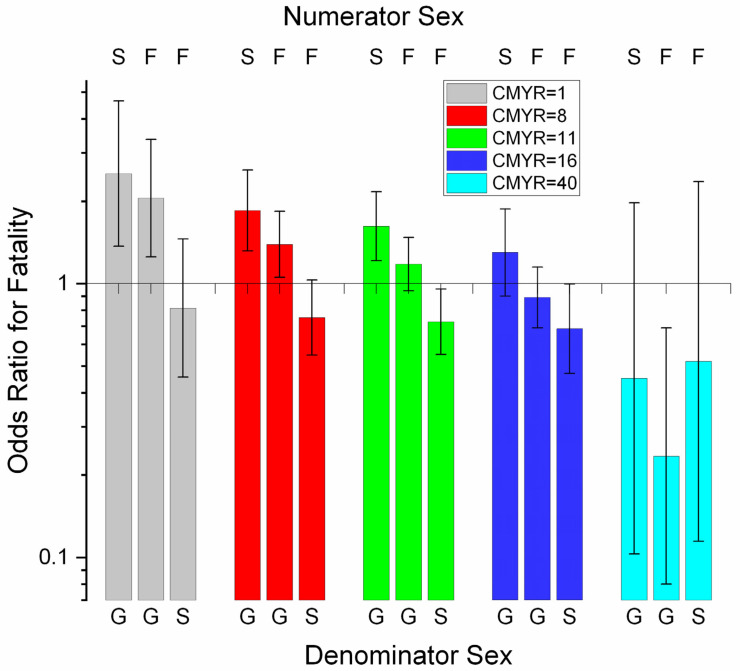
Figure 2.
Odds ratios for fatality for a SEX*CMYR (sex by cumulative work-events for the season) interaction identified in multivariable logistic regression modelling of fatalities among Thoroughbred racehorses in Ontario for the period 2003–2015, unit of interest—race work-event. The graph describes pairwise comparisons between SEX groups according to values of CMYR. For OR values above 1, the numerator odds of fatality are higher than the denominator odds. Intact stallions consistently had the highest odds of fatality until high levels of CMYR were reached, when geldings showed the highest fatality. Females showed intermediate fatality odds. Confidence intervals that include 1.0 are non-significant. F—female; G—gelding; S—stallion. (Note log scale on y-axis.)

