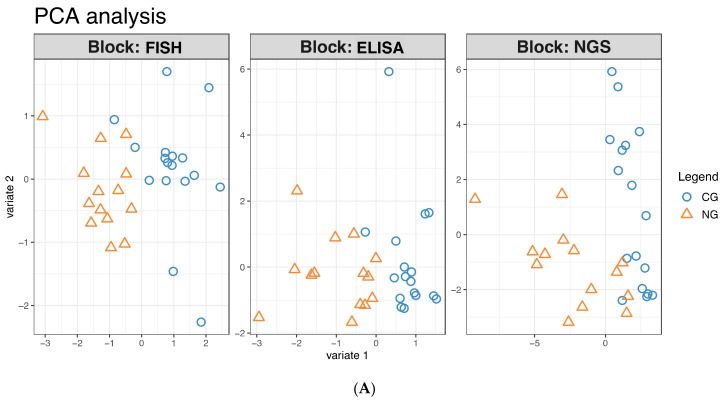
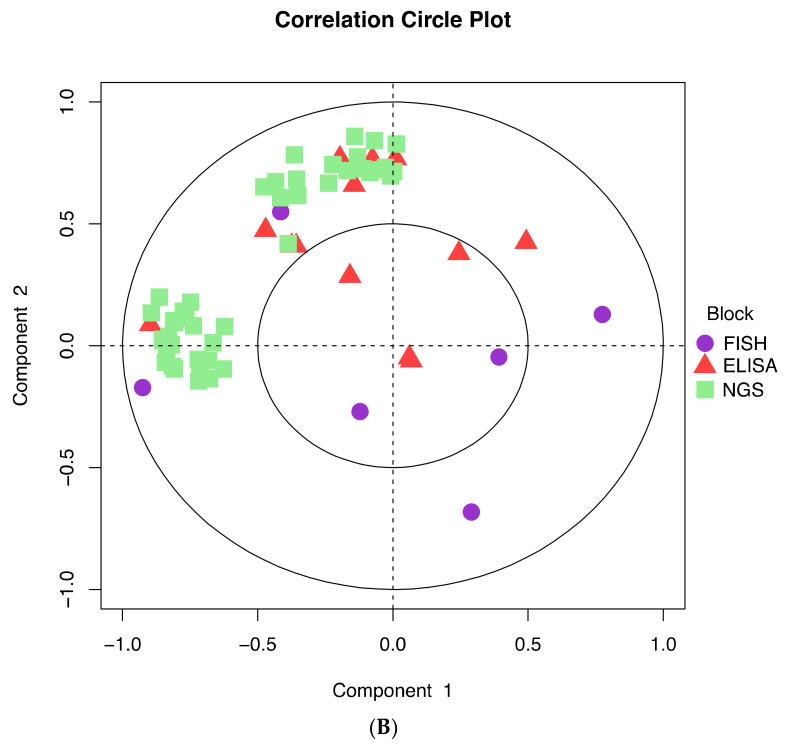
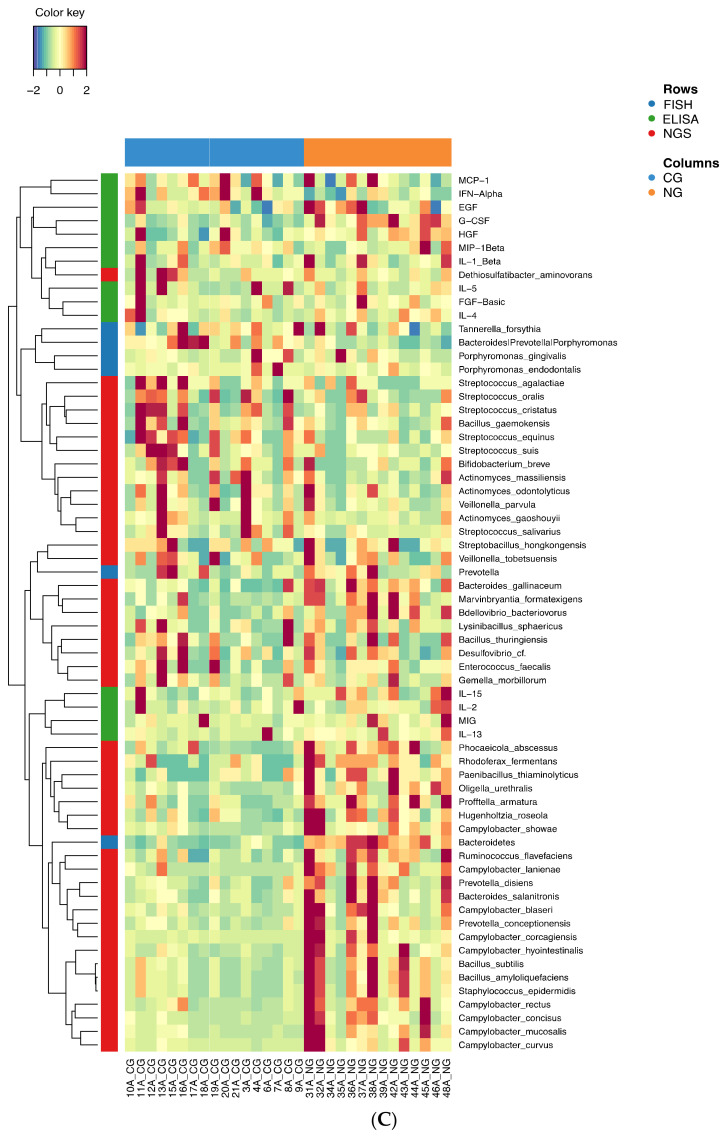
Figure 6.
Integration of the three sources of data. (A) Individual principal component plots for the three blocks. Plot generated using the function plotIndiv from the package mixOmics. (B) Correlation circle plot: the further away from the origin, the higher the discriminative power of the features. Features clustering together represent potential co-signature from multiple data sources. Plot generated using the function plotVar from the package mixOmics. (C) Heatmap highlighting co-segregation of different data sources and the discriminative potential of the resulting clusters. The key color scales are based on Z-scores and scaled based on the row mean. Plot generated using the function cimDiablo from the package mixOmics.


