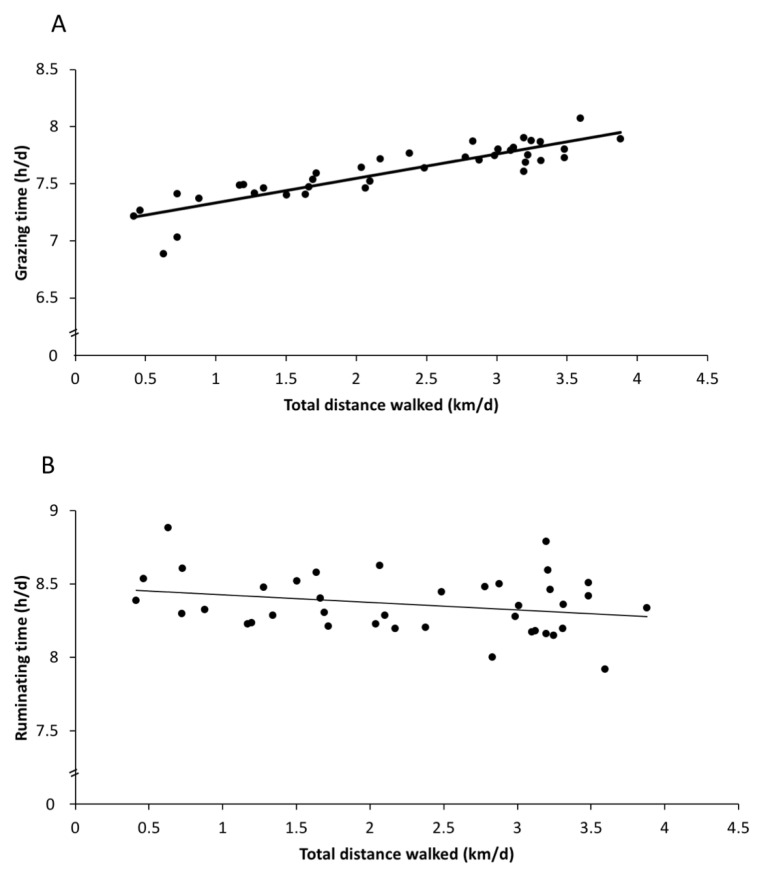
Figure 2.
Regression analysis of the total distance walked against behaviours in the paddock. (A) Grazing time increased with the distance walked, and (B) ruminating time decreased with the distance walked. The predicted values from the regression models are plotted for each of the 13 days for the 3 groups.

