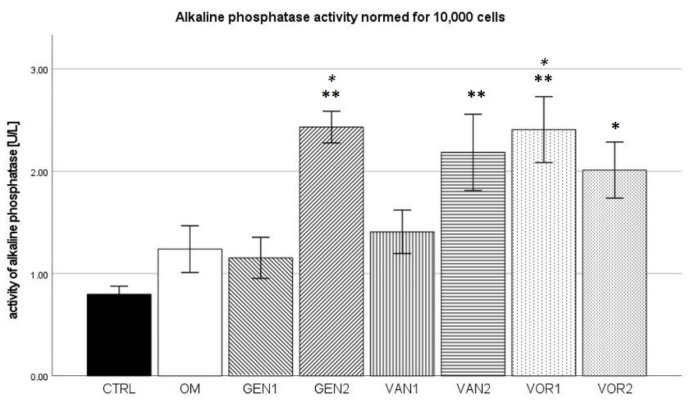
Figure 9.
Mean AP activity per group as measured in the cell culture medium, normed for 10,000 cells. The error bars show the error of mean. Significances are indicated by stars: bold stars indicate a significance compared to the negative control CTRL, stars in italics indicate a significance compare to the osteogenic control OM. * = significance p ≤ 0.05, ** = significance p ≤ 0.01.

